Published on:
In celebration of NWMLS’s 40th anniversary in 2024, let’s take a look at how the price of homes and condominiums have evolved over the years in a few key counties in the Pacific Northwest.
Median Closed Sale Price
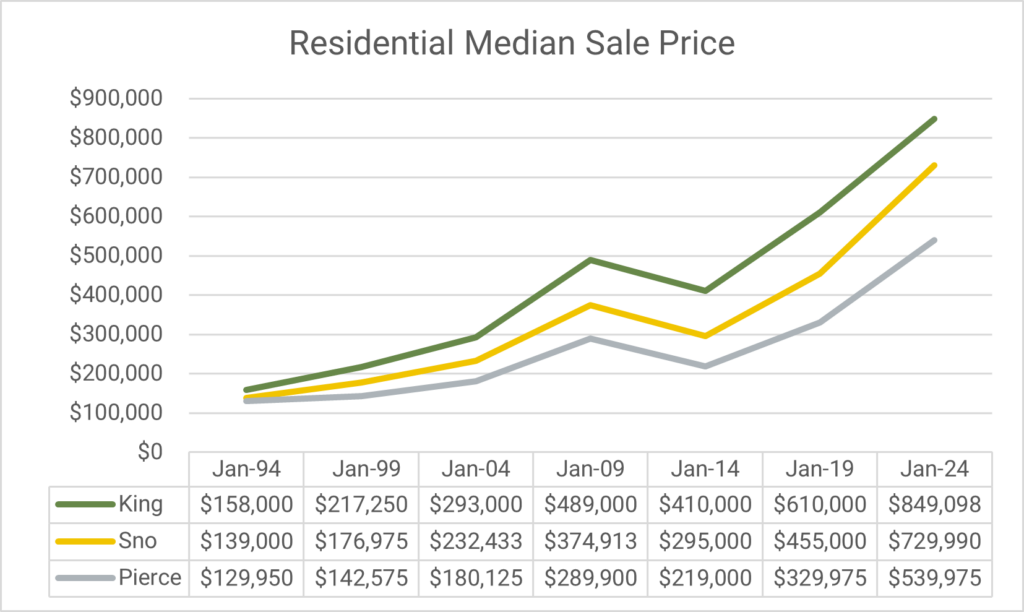
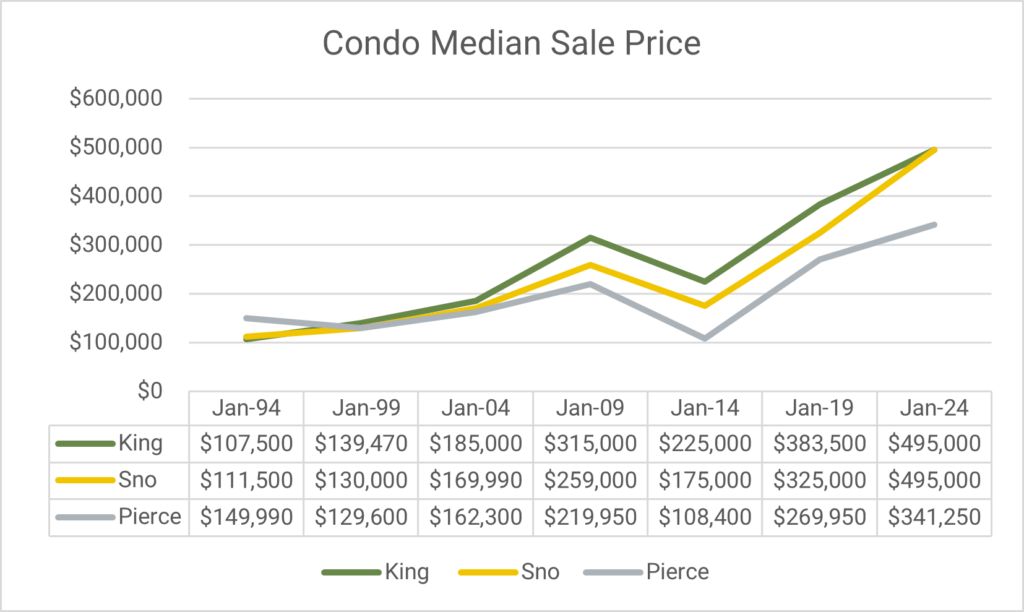
For many years, NWMLS has been tracking a variety of metrics each month in counties within its service area. One of these monthly metrics is Median Sale Price, which is the middle point in the price distribution of homes sold that month, meaning half of the sold properties were priced higher, and half were priced lower. Median Sale Price is considered a more accurate representation of the market than average sale price, as it is less affected by outliers.
In order to provide a historic view, let’s take a look at how the Median Sale Price for residential homes and condominiums has changed over the last 30 years in King, Snohomish, and Pierce counties. NWMLS now provides detailed statistical data for 26 counties, but in order to look at sale price trends going back to the 90s, this article will focus on King, Snohomish, and Pierce counties only.
In January 1994, the Median Sale Price for a residential home was $158,000 in King County, $139,000 in Snohomish, and $129,950 in Pierce!


Despite the declines during the subprime mortgage crash of the late 2000s, buying a home or condominium ultimately proved to be a solid long-term investment for most buyers.
Changes to Median Sale Price
For another perspective, here’s a look at the median closed sale price represented as a percentage increase or decrease for each five-year period.
| Residential | 1994 – 1999 | 1999 – 2004 | 2004 – 2009 | 2009 – 2014 | 2014 – 2019 | 2019 – 2024 |
| King | +34% | +66% | +48% | -16% | +48% | +39% |
| Snohomish | +27% | +31% | +61% | -21% | +54% | +60% |
| Pierce | +9% | +26% | +61% | -24% | +50% | +63% |
| Condo | 1994 – 1999 | 1999 – 2004 | 2004 – 2009 | 2009 – 2014 | 2014 – 2019 | 2019 – 2024 |
| King | +29% | +32% | +70% | -28% | +70% | +29% |
| Snohomish | +16% | +30% | +52% | -32% | +85% | +52% |
| Pierce | -13% | +25% | +35% | -50% | +149% | +26% |
Average Days of Inventory
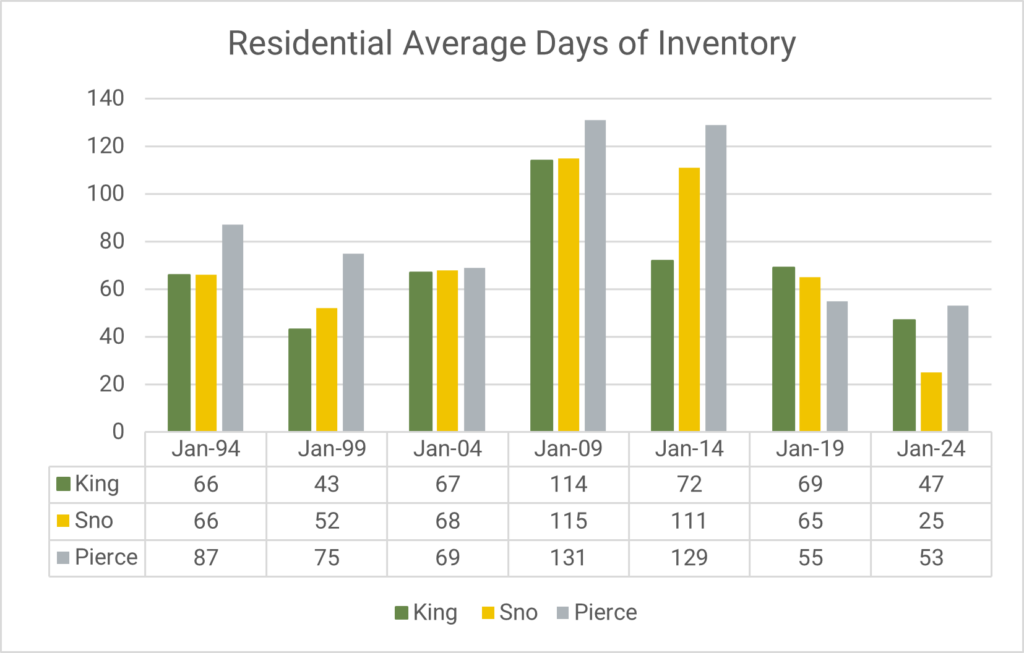
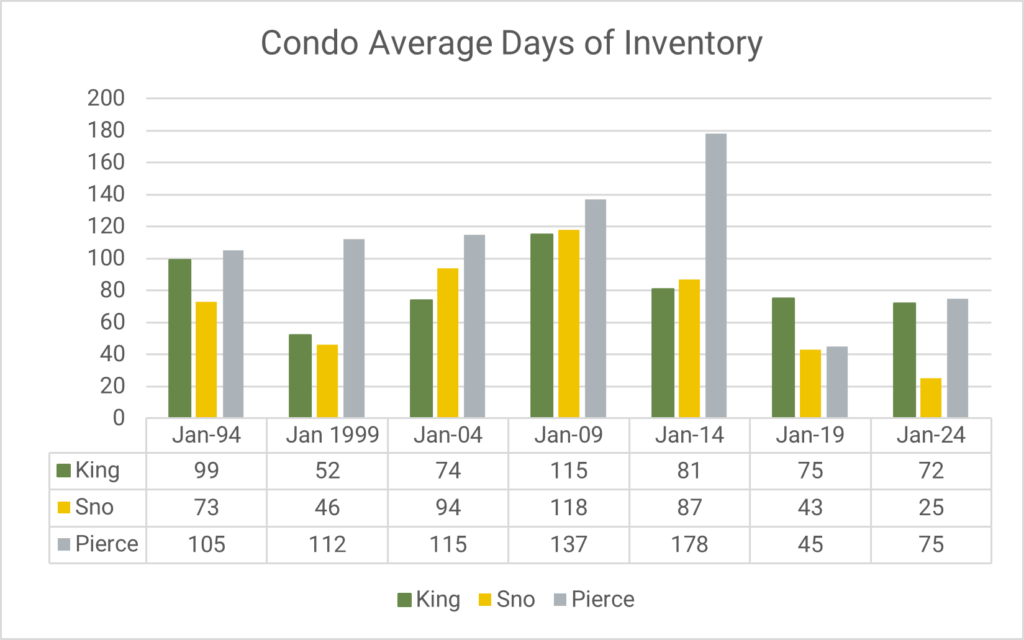
Another key metric that NWMLS tracks is the Average Days of Inventory. This metric represents the average number of days a property is on the market during a specific month. A balanced market is considered to be four to six months (120 – 180 days) by most industry experts. NWMLS data shows that over the last 30 years, King, Snohomish, Pierce counties have had less inventory than what is considered to be a balanced market, except for the period during the subprime mortgage crash of the late 2000s.
When comparing Median Sale Price and Average Days of Inventory, housing prices typically rise when there is low inventory, and decline as inventory increases.


2024 & Beyond
NWMLS has expanded over the years, merging with 22 MLSs to become the largest member-owned, not-for-profit multiple listing service in the region and now provides market listing data for 26 counties.
To ensure our membership has access to an array of products, services, and support to help them deliver an exceptional experience to their clients, we continuously review existing products and track new and advanced technology.
One recent addition to make tracking market data easier, includes adding interactive charts to the Monthly Market Snapshot, offering the ability to view a variety of metrics for each of the counties in our service area: View the Monthly Market Snapshot.