April 2024 Overview
Monthly Market Update
Market activity increases despite “constrained” mortgage rate impactsActive Listings
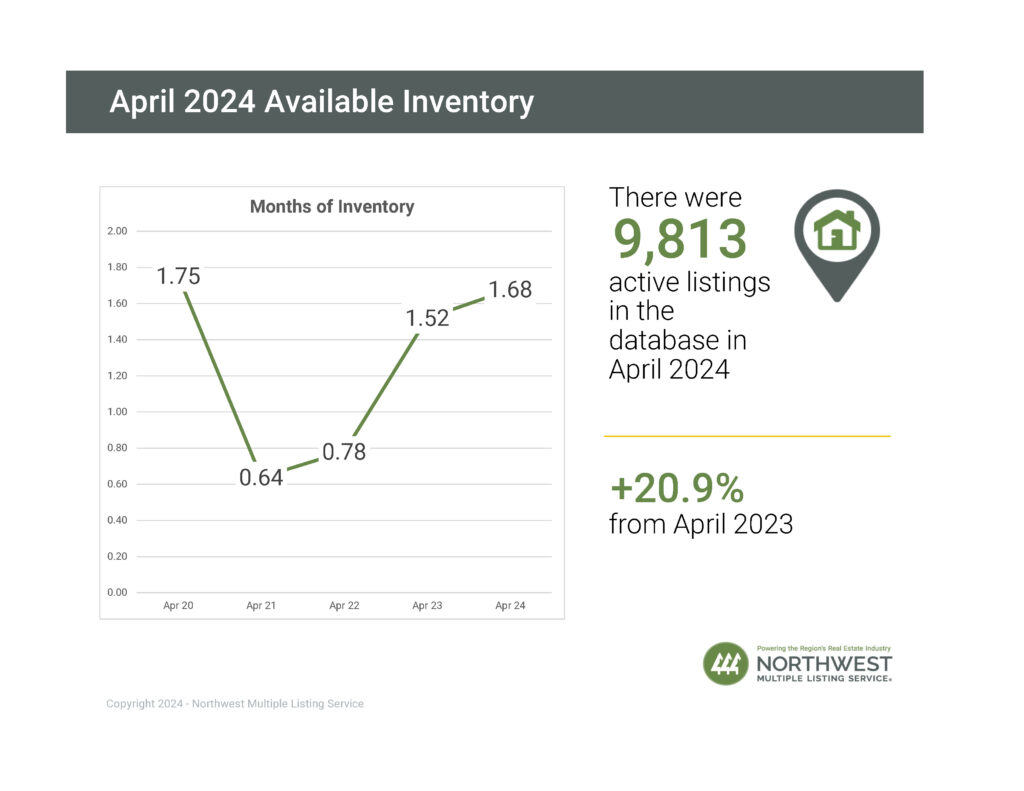
There were 9,813 active listings on the market at the end of April 2024, an increase nearly 21% when compared to April 2023 (8,114). The number of homes on the market increased throughout Washington with 23 out of 26 counties seeing a year-over-year increase.
Select a county in the chart below to view the available inventory counts in a particular county:
New Listings
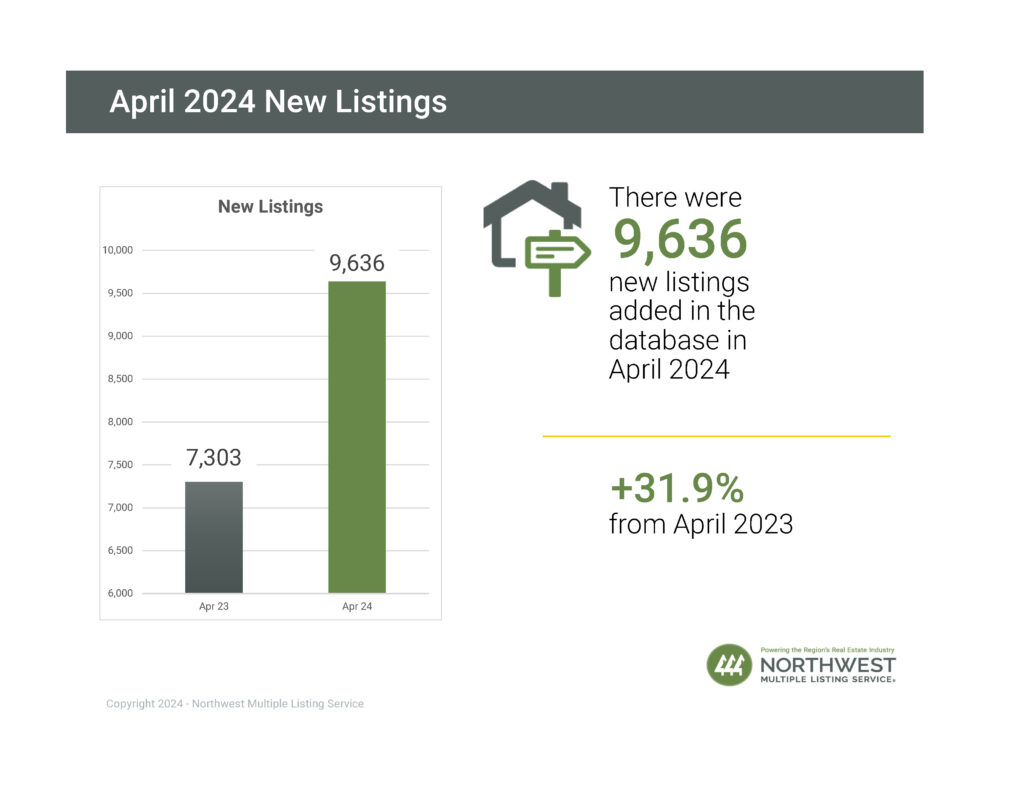
NWMLS brokers added 9,636 new listings to the database in April 2024, an increase of nearly 32% compared to April 2023, when 7,303 new listings were added. The five counties with the largest increase in the number of new listings were Chelan (+70.59%), followed by Kittitas (+70.21%), Douglas (+65.79%), Lewis (+53.26%), and Kitsap (+48.84%).
Use the drop-down menu in the chart below to view the number of new listings added in each county:
Pending Sales
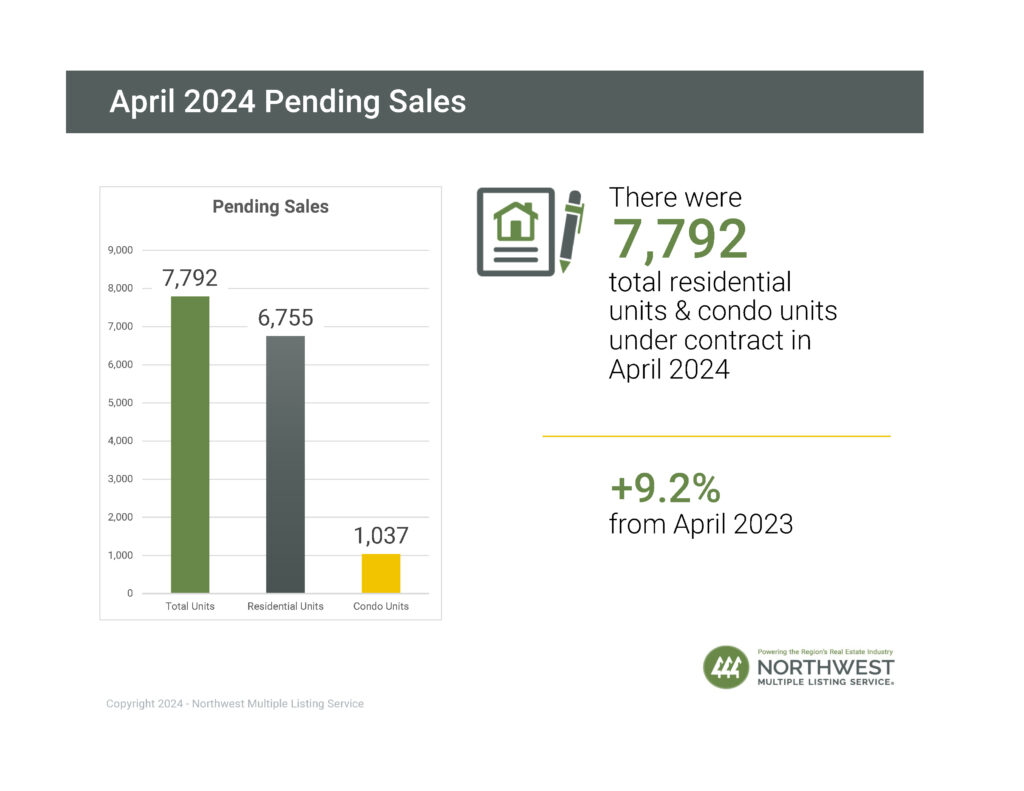
There were 7,792 total residential units & condo units under contract in April 2024, an increase of 9.2% when compared to April 2023 (7,137). The counties with the largest increase in the number of pending sales were Columbia, Ferry, Okanogan, Walla Walla, Grant, Cowlitz and King.
Select a county in the chart below to view the pending sales:
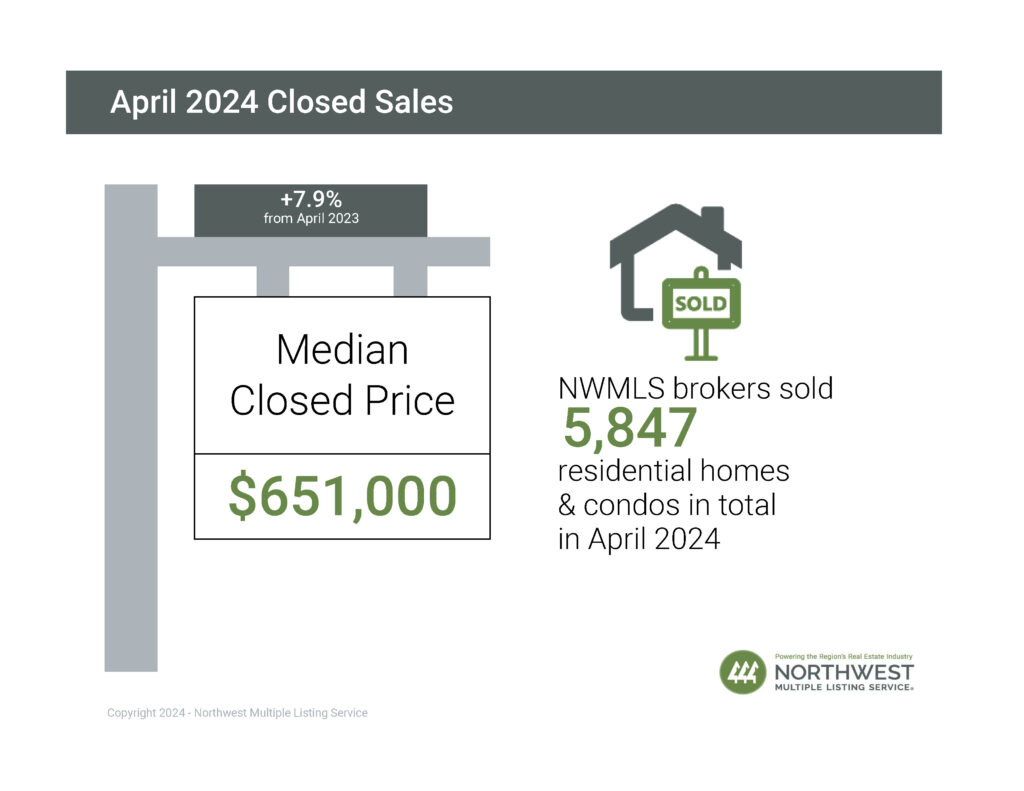
Closed Sales
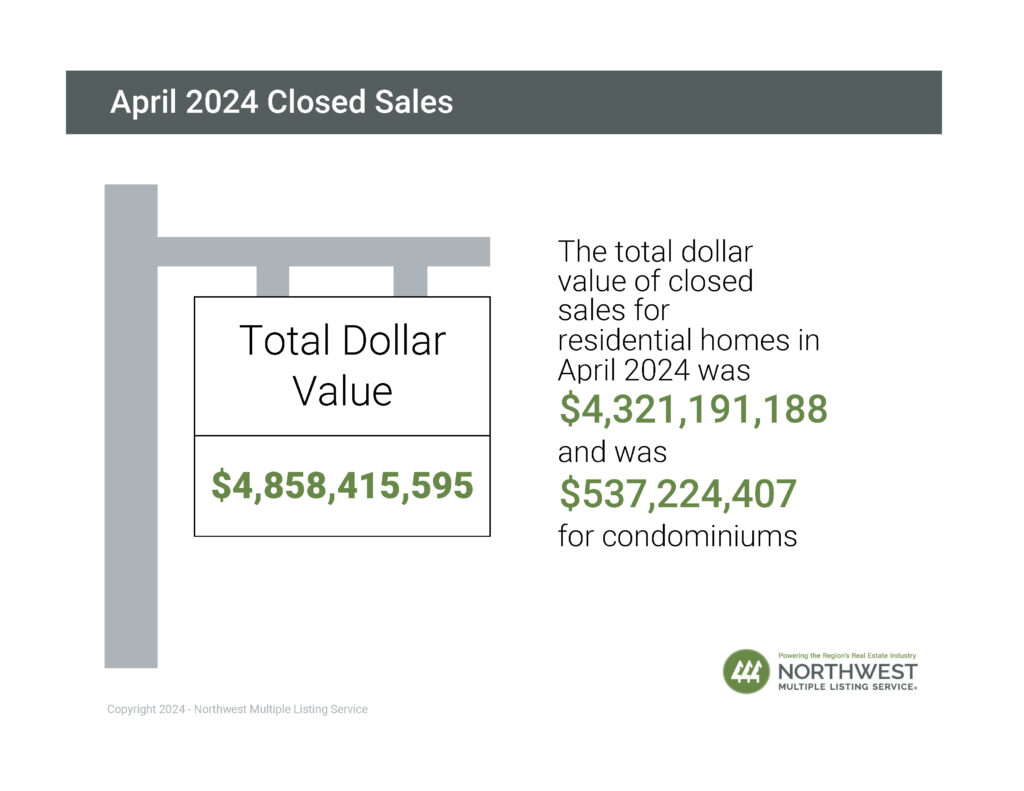
April 2024 saw a nearly 10% increase in the number of closed sales transactions year-over-year. The total dollar value of closed sales for residential homes for this month was $4,321,191,188 and was $537,224,407 for condominiums.
Select a county from the chart below to view the number of closed sales:
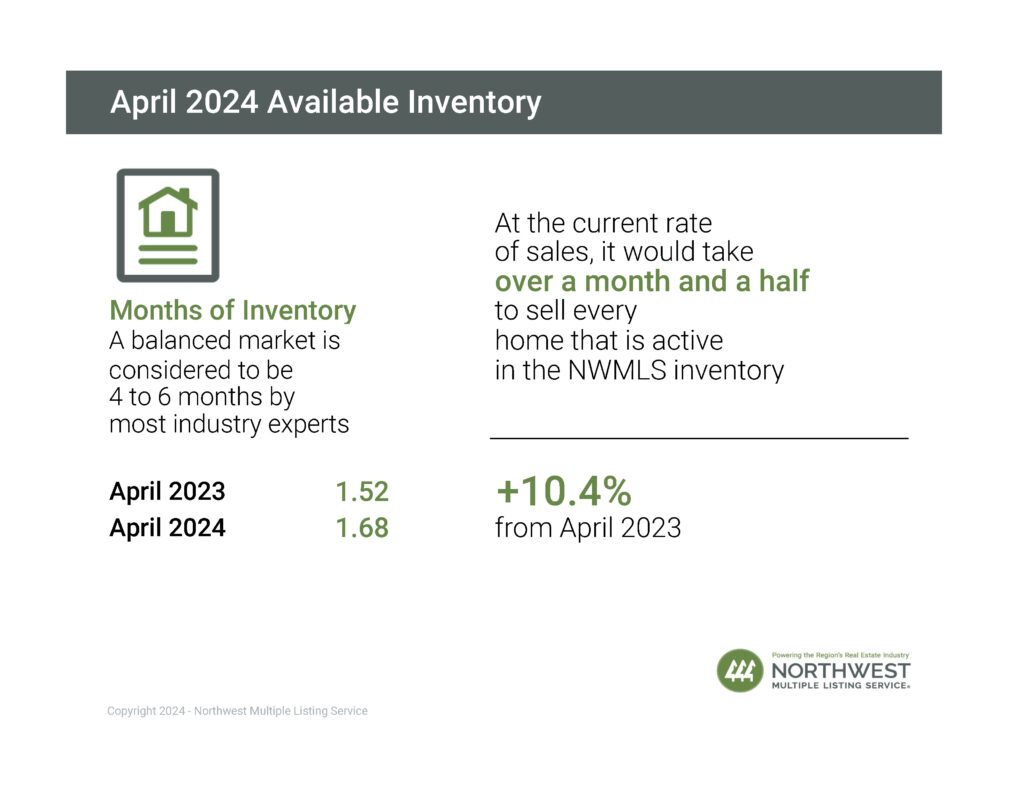
Months of Inventory
A balanced market is considered to be 4 to 6 months by most industry experts. At the current rate of sales, it would take less than two months to sell every home that is active in the NWMLS inventory. The five counties with the lowest months of inventory in March 2024 were Snohomish (0.83), King (1.27), Thurston (1.47), Pierce (1.48), and Cowlitz (1.57).
Median Price
Overall, the median price for residential homes and condominiums sold in April 2024 was $651,000, up 7.9% when compared to April 2023 ($603,250). The median sales price increased in 23 out of 26 counties.
The three counties with the highest median sale prices were San Juan ($1,055,000), King ($875,000), and Snohomish ($738,000), and the three counties with the lowest median sale prices were Grant ($340,000), Adams ($331,500), and Okanogan ($317,000).
Select a county from the chart below to view its median sales price:
Market Snapshot Video
View Individual Counties in PDF Format

Historical Charts
Get granular on real estate statistics with interactive 5-year charts encompassing the length of active, new, and additional metrics.
Usage Terms
You may share and republish NWMLS’s Market Snapshot Video, interactive charts, and infographics on websites, blogs, and social media. Any use of NWMLS’s statistical charts or infographics must include the logo that is displayed on the graphics and the following attribution: “Information and statistics compiled and reported by the Northwest Multiple Listing Service.” You may not alter or otherwise modify NWMLS’s Market Snapshot Video, interactive charts, and infographics. Derivatives of NWMLS’s housing marketing statistics may not be published, broadcast, rewritten or redistributed without prior written permission.