Published on:

Median priced homes in Washington, estimated at $430,000, are unaffordable to 76% of the households in the state, according to an analysis by the Building Industry Association of Washington (BIAW).
Newly built homes (excluding resales), at an average price of $635,131 (more than $200,000 higher than the national average), are out of reach for an estimated 81% of Washington’s households.
In its recently released Housing Affordability Index, BIAW built on the 2023 “Priced Out” report from the National Association of Home Builders (NAHB). That study explores how higher prices and interest rates affect housing affordability.
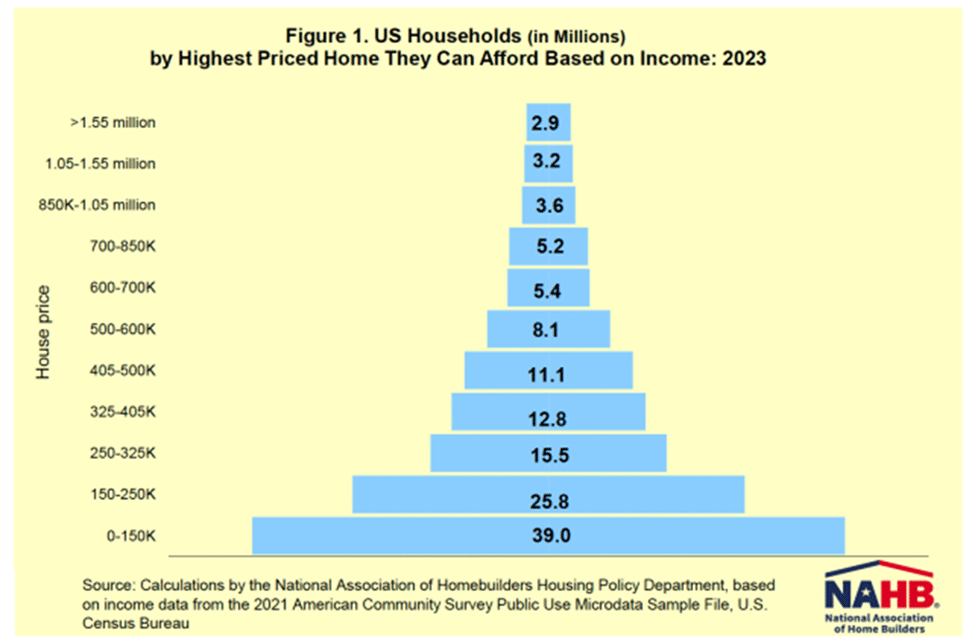
Estimates for this year show that 96.5 million households in the U.S. cannot afford a median priced home because their incomes are insufficient to qualify for the required mortgage under standard underwriting criteria.
Researchers at NAHB analyzed the impact of incremental increases in both prices and interest rates. For example, assuming a mortgage interest rate of 6.25%, if the median home price of $425,786 rises by $1,000 an additional 140,436 households would be priced out.
If the interest rate increases from 6.25% to 6.50%, NAHB calculated the median priced new home would be unattainable for 12,862 households.
NAHB’s priced-out estimates are based on the sum of the mortgage payment (including the principal amount, loan interest, property tax, homeowners’ property and private mortgage insurance premiums (PITI) not exceeding 28% of monthly gross household income).
Using various price ranges, the home builders’ organization created a priced-out pyramid:
NAHB also provided priced out estimates for all states and more than 300 metropolitan areas in the U.S.
For its Washington Housing Affordability Index, BIAW considered the median cost of both new and existing homes as well as changing interest rates and the added costs attributed to public policy decisions.
In releasing its findings, BIAW said it hopes policymakers will better understand the effects of their decisions on the state’s housing crisis.
A comparison of counties shows considerable variation across the state. BIAW’s chart compares Area Median Income (AMI), median household income, median home sales price, income needed to qualify and the percentage of families that can and cannot afford the median priced home in each county.
At least half the families can afford the median priced home in only two counties, Columbia and Ferry.
Seventy-five percent or more of the families in 26 of the state’s 39 counties cannot afford the median priced home: Asotin, Chelan, Clallam, Clark, Cowlitz, Douglas, Franklin, Grays Harbor, Island, Jefferson, King, Kitsap, Kittitas, Klickitat, Lewis, Mason, Pierce, San Juan, Skagit, Skamania, Snohomish, Spokane, Wahkiakum, Walla Walla, Whatcom, and Yakima.
Households Priced Out of the Market by a $1,000 Price Increase, 2023
(selected metro areas in Washington state)
| Area | Median New Home Price | Income Needed to Qualify | Total Households | Households Unable to Afford the Median Price | Additional Households Priced Out by a $1,000 Increase |
| United States | $425,786 | $129,645 | 132,469,710 | 96,537,344 | 140,436 |
| Washington | $635,131 | $186,757 | 3,114,782 | 2,527,592 | 1,737 |
| Bremerton-Silverdale, Port Orchard | $904,759 | $264,726 | 105,285 | 104,415 | 62 |
| Kennewick-Richland | $774,079 | $228,665 | 110,005 | 107,264 | 62 |
| Longview | $586,207 | $173,358 | 43,622 | 41,116 | 19 |
| Mount Vernon-Anacortes | $297,829 | $87,770 | 55,074 | 32,188 | 93 |
| Olympia-Lacey-Tumwater | $581,517 | $172,904 | 121,625 | 93,093 | 93 |
| Seattle-Bellevue-Kent | $805,128 | $235,795 | 1,267,391 | 1,055,105 | 856 |
| Tacoma-Lakewood | $805,128 | $238,470 | 362,267 | 352,084 | 245 |
| Spokane-Spokane Valley | $682,211 | $201,963 | 244,390 | 226,736 | 92 |
| Walla Walla | $569,347 | $170,815 | 23,724 | 20,861 | 11 |
| Wenatchee | $582,155 | $170,609 | 50,853 | 41,321 | 36 |
| Yakima | $553,066 | $165,036 | 90,099 | 81,828 | 56 |
In addition to data, charts and maps, the BIAW report included policy implications and recommendations.
“While many of the variables that make up the housing market are largely out of the state and local governments’ control, there are a number of variables we can control with logical public policy to ensure homeownership opportunities can persist for generations to come,” the authors stated.
Noting the Growth Management Act (GMA) mandates counties plan for housing for all levels of the economic ladder, BIAW called for expanded downpayment assistance to those who make higher thresholds of AMI, saying do so “will be crucial for keeping the American Dream of homeownership alive.”
The BIAW report also outlined various regulatory reforms, starting with the GMA. Reexamining some building codes and creating a more predictable building environment were also measures the group listed.
Andrea Smith, MPA, the policy and research manager at BIAW, prepared the Housing Affordability Index report.
BIAW is the state’s largest trade association and one of the largest home building associations in America. Its 8,000 member companies include builders, remodelers, skilled trade professionals and their associates.
NAHB has more than 140,000 members who employ more than 10 million people across the country. Together, they build more than 80% of all new housing in the U.S. The federation encompasses more than 700 state and local associations.