MONTHLY MARKET SNAPSHOT
Real Estate Market
-
March 2025 Overview
Monthly Market Update
Early spring shows initial signs of market warm-up
Interactive County Charts
Visualize year-over-year real estate statistics for specific counties, such as active listings, new listings, pending sales, closed sales, and months of inventory.
Active Listings
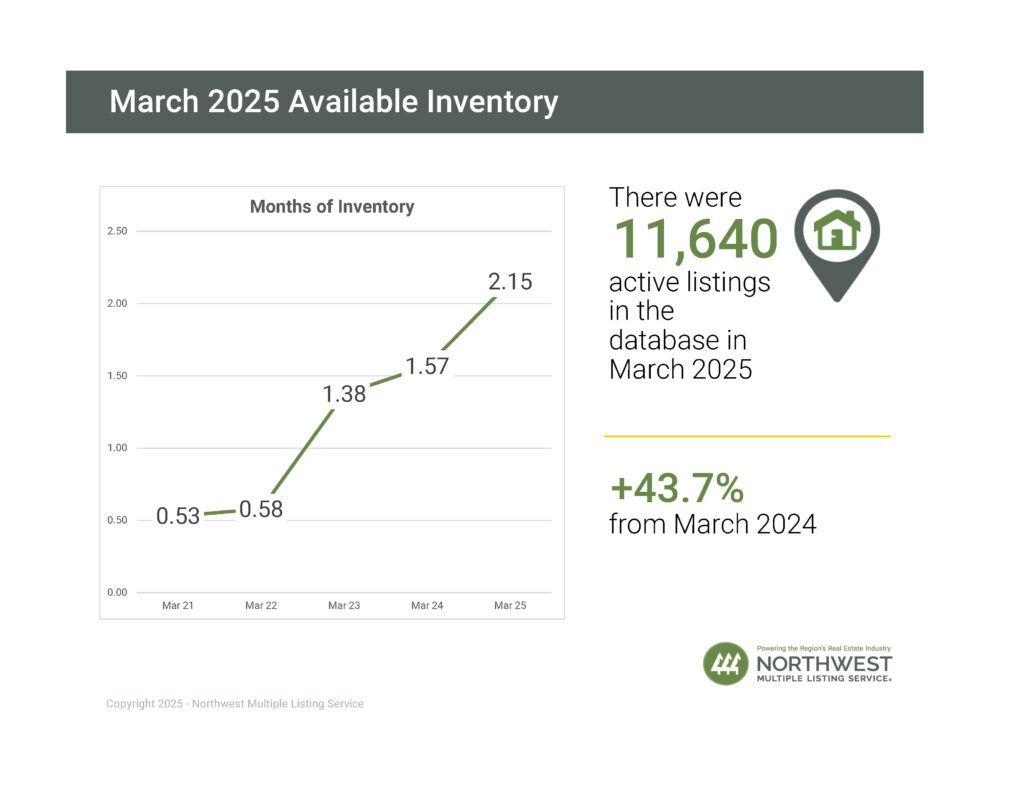
There was a 43.7% increase in total number of properties listed for sale year-over-year, with 11,640 active listings on the market at the end of March 2025, compared to 8,100 at the end of March 2024. When compared to the previous month, active inventory increased by 1,192 listings (+11.4%), up from 10,448 in February 2025.
The number of homes for sale year-over-year increased throughout the NWMLS coverage area, with 21 out of 26 counties seeing a double-digit year-over-year increase. The six counties with highest year-over-year increases in active inventory for sale were Snohomish (+83.1%), Whatcom (+63.1%), King (+59.8%), Cowlitz (+51.7), Kittitas (+48.3%), and Grant (+43.8%).
Use the drop-down menu in the chart below to view the available inventory counts in each county:
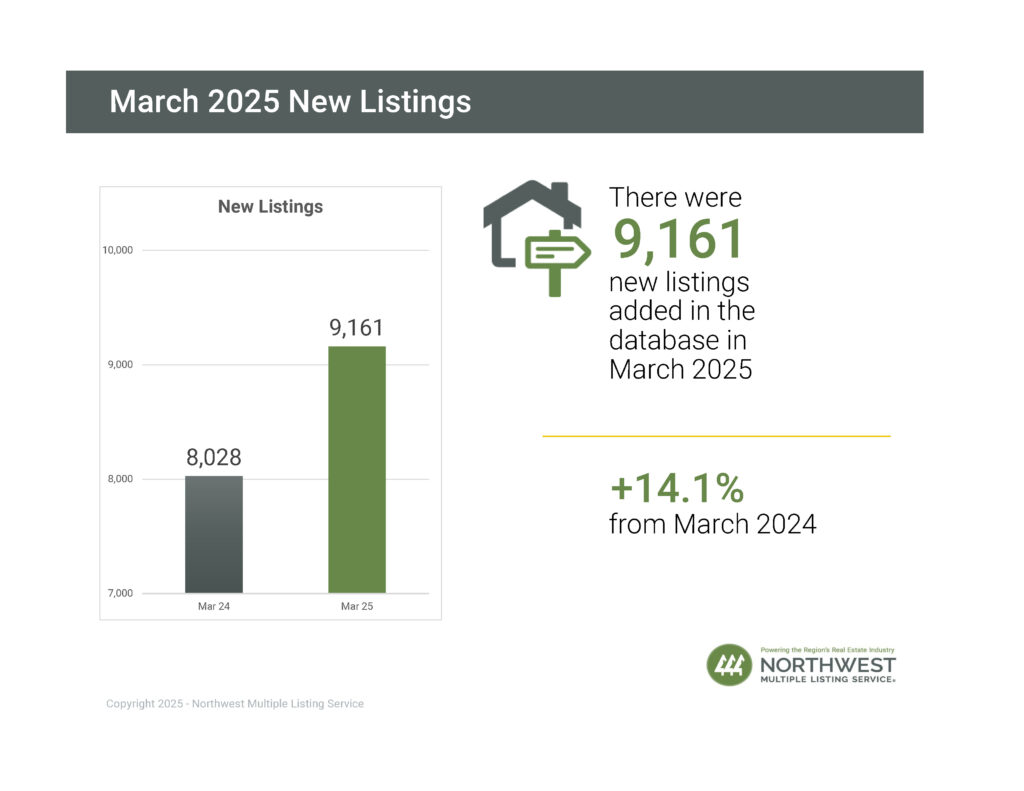
New Listings
NWMLS brokers added 9,161 new listings to the database in March 2025, a year-over-year increase of 14.1% compared to March 2024 (8,028). When compared to the previous month (February 2025), new listings increased by 44.4%, when 6,346 listings were added to the NWMLS database.
The number of new listings increased year-over-year in 21 of 26 counties and rose in all counties compared to last month. The six counties with the largest year-over-year increases were San Juan (+70.6%), Jefferson (+61.5%), Island (+42.1%), Whatcom (+41.6%), Douglas (+28.9%), and Grays Harbor (+24.5%).
Use the drop-down menu in the chart below to view the number of new listings added in each county:
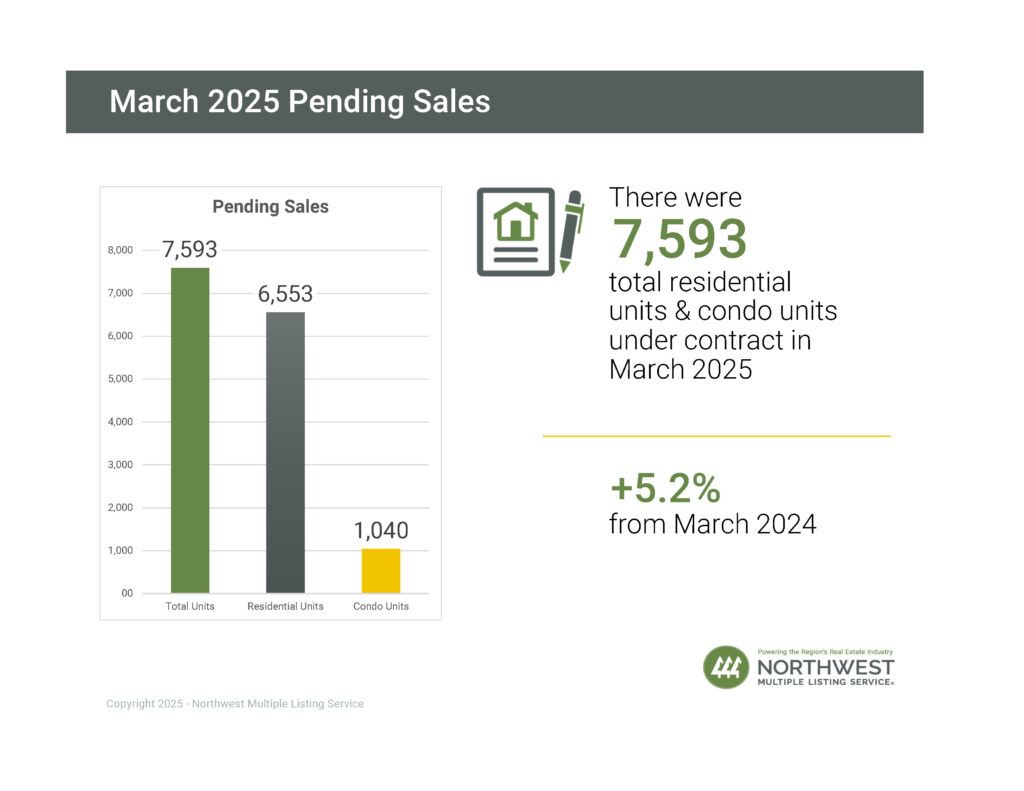
Pending Sales
There were 7,593 residential units & condo units under contract in March 2025, an increase of 5.2% when compared to March 2024 (7,218). When compared to the previous month, the number of pending listings increased by 29.5%, up from 5,863 listings under contract in February 2025.
The number of pending sales increased year-over-year in 17 of 26 counties and rose in all but two counties when compared to pending sales last month. The six counties with the largest year-over-year increases in pending sales were Chelan (+39.3%), Island (+35.4%), Grays Harbor (+26.4%), San Juan (+26.3%), Jefferson (+23.5%), and Skagit (+22.3%).
Use the drop-down menu in the chart below to view the pending sales in each county:
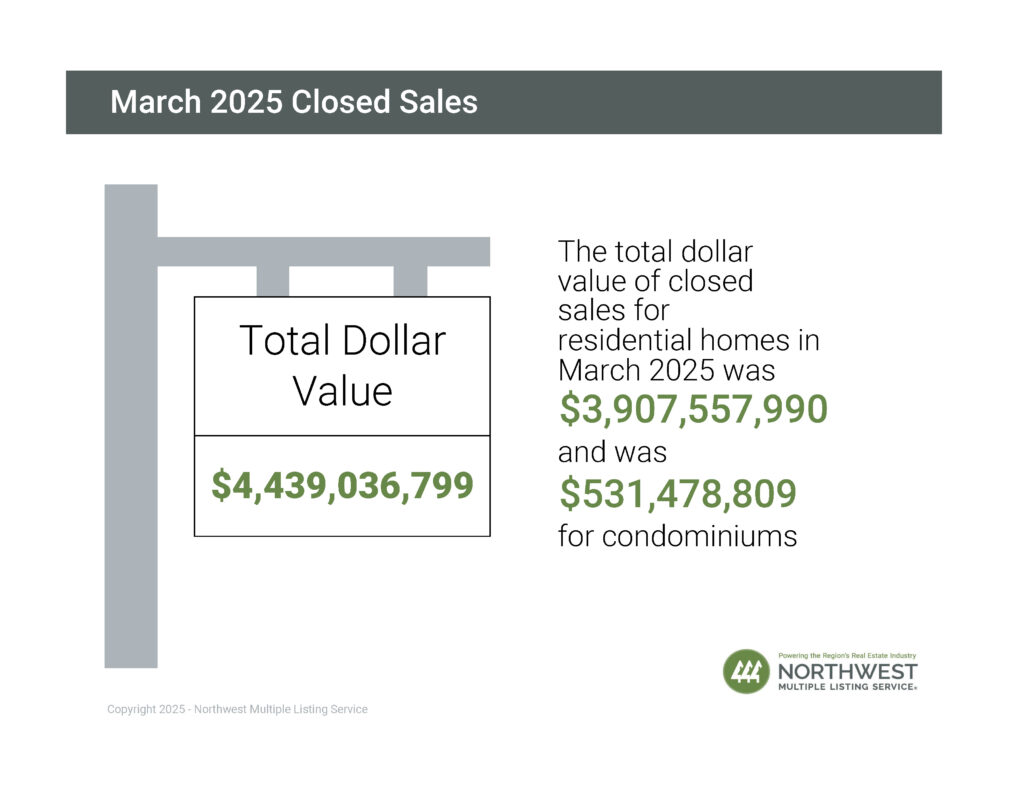
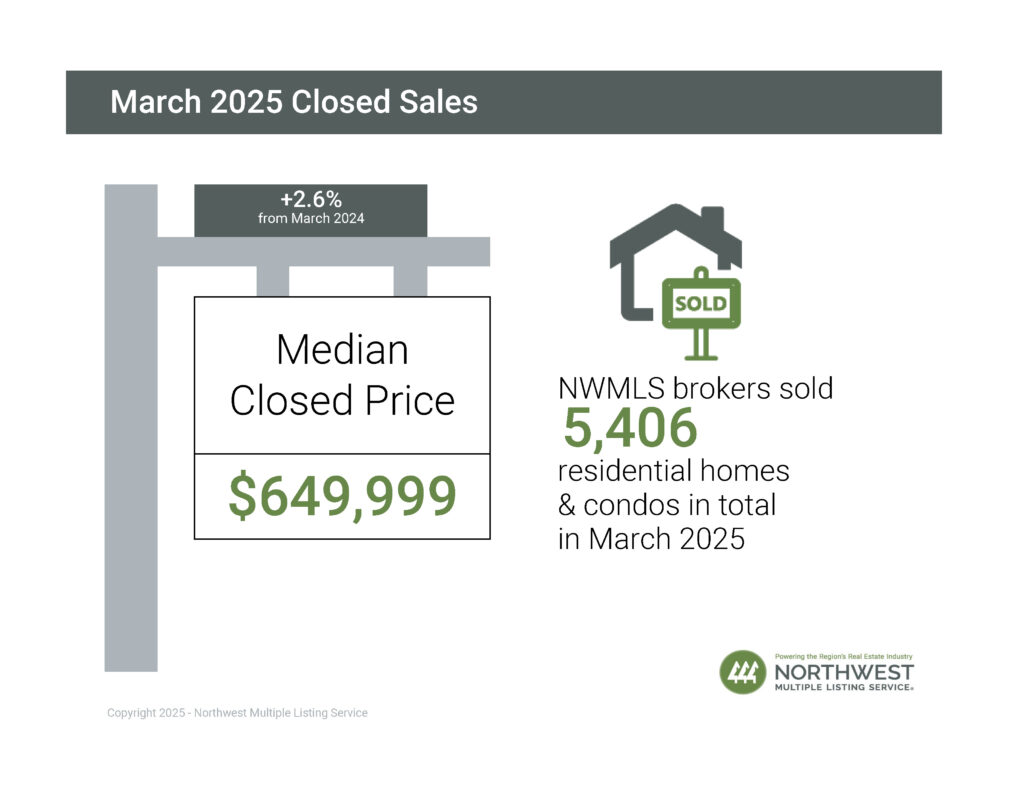
Closed Sales
The number of closed sales increased slightly by 1.9% year-over-year (4,268 in February 2025 compared to 4,189 in February 2024). When compared to the previous month, The number of closed sales increased by 4.7% year-over-year (5,406 in March 2025 compared to 5,165 in March 2024). When compared to the previous month, the number of closed sales increased by 26.7%, up from 4,268 sales in February 2025.
15 out of 26 counites saw an increase in the number of closed sales year-over-year. The six counties with the largest increases were Douglas (+66.7%), Adams (+40%), Skagit (+35.3%), Jefferson (+34.6%), Chelan (+25%), and Cowlitz (+21.3%). The total dollar value of closed sales in March 2025 for residential homes was $3,907,557,990 and was $531,478,809 for condominiums $4,439,036,799 in total), an increase of 7% when compared to March 2024.the number of closed sales increased by 14.5%, up from 3,727 sales in January 2025.
Use the drop-down menu in the chart below to view the number of closed sales in each county:
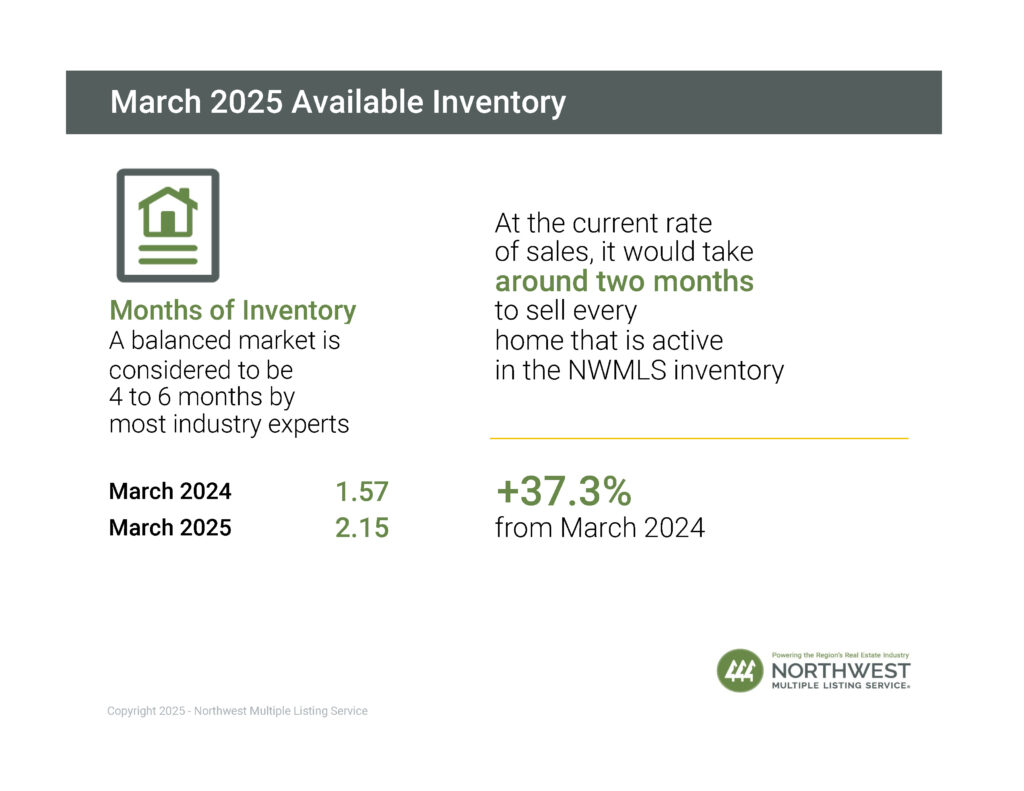
Months of Inventory
A balanced market is considered to be 4 to 6 months by most industry experts. At the current rate of sales, it would take a little more than two months (2.15) to sell every home that is active in the NWMLS inventory. The six counties with the lowest months of inventory in March 2025 were Snohomish (1.39), Pierce (1.67), Kitsap (1.86), King (1.86), Thurston (1.9), and Skagit (1.94).
Use the drop-down menu in the chart below to view the months of inventory in each county:
Median Price
Overall, the median price for residential homes and condominiums sold in March 2025 was $649,999, an increase of 2.6% when compared to March 2024 ($633,717). When compared to last month, the median price increased by 3.2%, up from $630,000 in February 2025.
The three counties with the highest median sale prices were San Juan ($870,000), King ($855,000), and Snohomish ($755,000), and the three counties with the lowest median sale prices were Columbia ($220,000), Ferry ($268,725), and Grays Harbor ($335,100).
Use the drop-down menu in the chart below to view the median sales price in each county:

Market Snapshot Video
Watch a short video with the most current real estate statistics – great to share with clients!
View Individual Counties in PDF Format

Historical Charts
Get granular on real estate statistics with interactive 5-year charts encompassing the length of active, new, and additional metrics.
Usage Terms
You may share and republish NWMLS’s Market Snapshot Video, interactive charts, and infographics on websites, blogs, and social media. Any use of NWMLS’s statistical charts or infographics must include the logo that is displayed on the graphics and the following attribution: “Information and statistics compiled and reported by the Northwest Multiple Listing Service.” You may not alter or otherwise modify NWMLS’s Market Snapshot Video, interactive charts, and infographics. Derivatives of NWMLS’s housing marketing statistics may not be published, broadcast, rewritten or redistributed without prior written permission.