MONTHLY MARKET SNAPSHOT
Real Estate Market
-
August 2024 Overview
Monthly Market Update
Will Increases in Inventory and Lower Mortgage Rates Ease Affordability?Active Listings
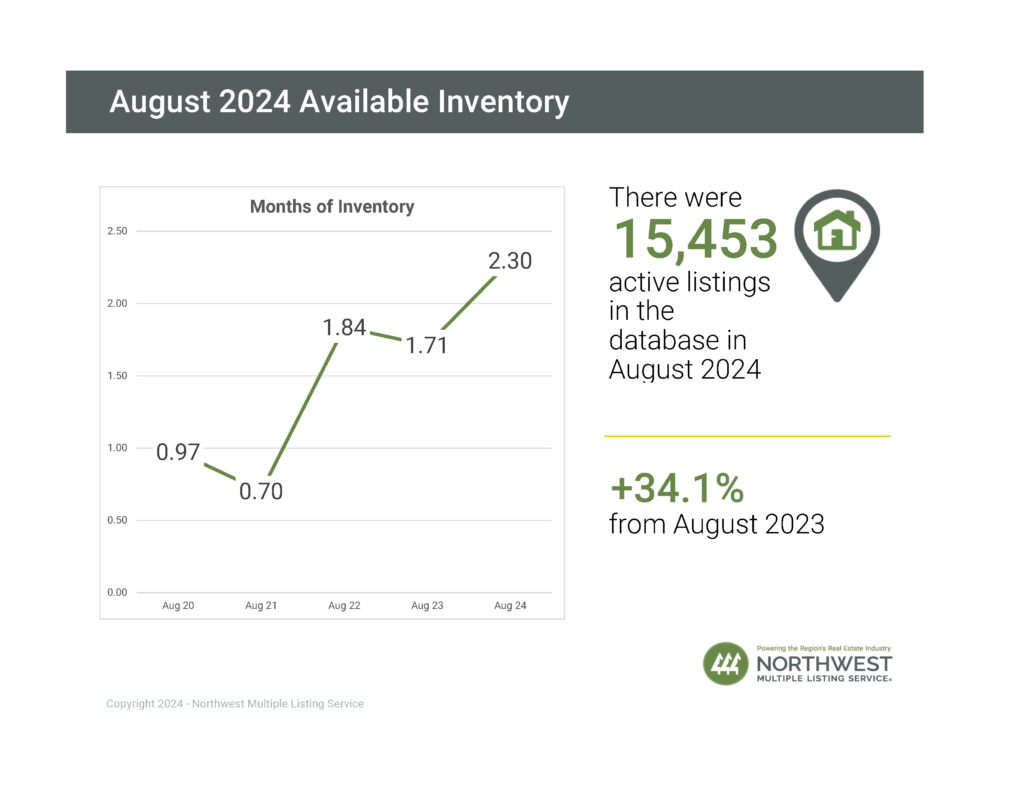
There was a 34.1% increase in total number of properties listed for sale, with 15,453 active listings on the market at the end of August 2024, compared to 11,525 at the end of August 2023. The number of homes for sale increased throughout Washington, with 25 out of 26 counties seeing a double-digit year-over-year increase. The five counties with highest increases in active inventory for sale were Douglas (+65.1%), Mason (+49.2%), Lewis (+49%), Pacific (+48%), and Pierce (+43%).
Use the drop-down menu in the chart below to view the available inventory counts in each county:
New Listings
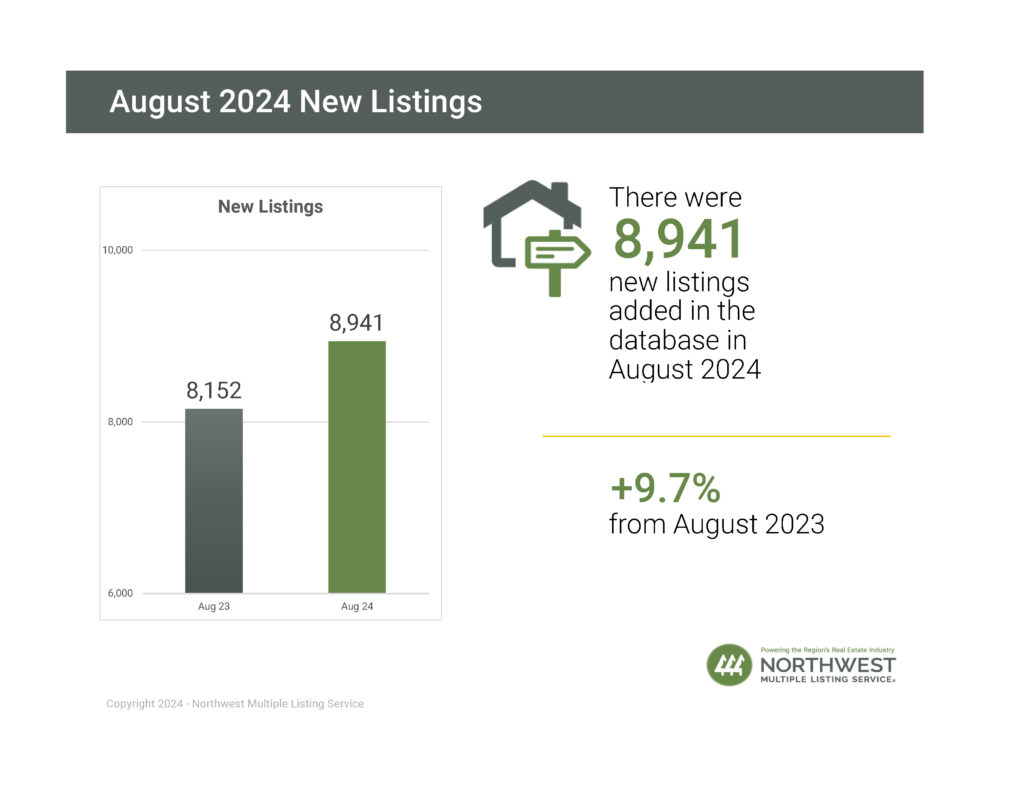
NWMLS brokers added 8,941 new listings to the database in August 2024, an increase of 9.7% compared to August 2023 (8,152). The five counties with the largest increase in the number of new listings added to the NWMLS database last month were Ferry (+83.3%), Douglas (+45.5%), Pacific (+43.4%), Clallam (+34.7%), and San Juan (+28.1%).
Use the drop-down menu in the chart below to view the number of new listings added in each county:
Pending Sales
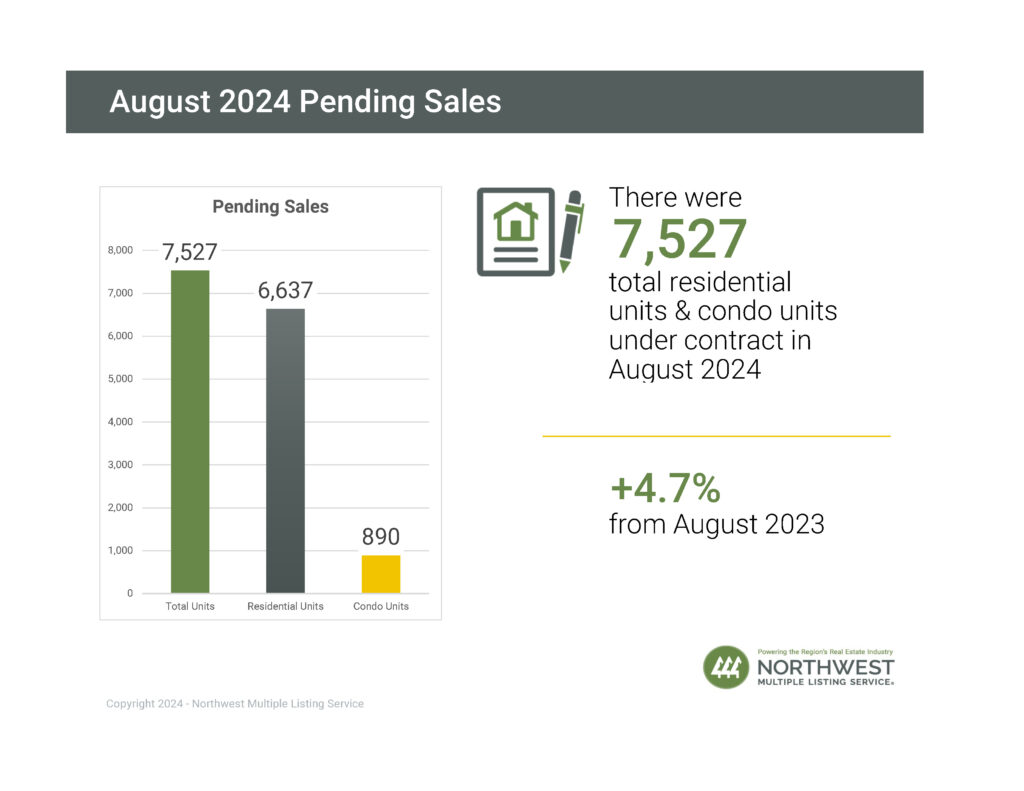
There were 7,527 total residential units & condo units under contract in August 2024, an increase of 4.7% when compared to August 2023 (7,189). 13 out of 26 counties saw a year-over-year increase in the number of pending listings, with the highest year-over-year increases in Ferry (+60%), Douglas (+35.1%), Clallam (+33.8%), Walla Walla (+19.6%), Snohomish (+15.2%), and Skagit (+12.5%).
Use the drop-down menu in the chart below to view the pending sales in each county:
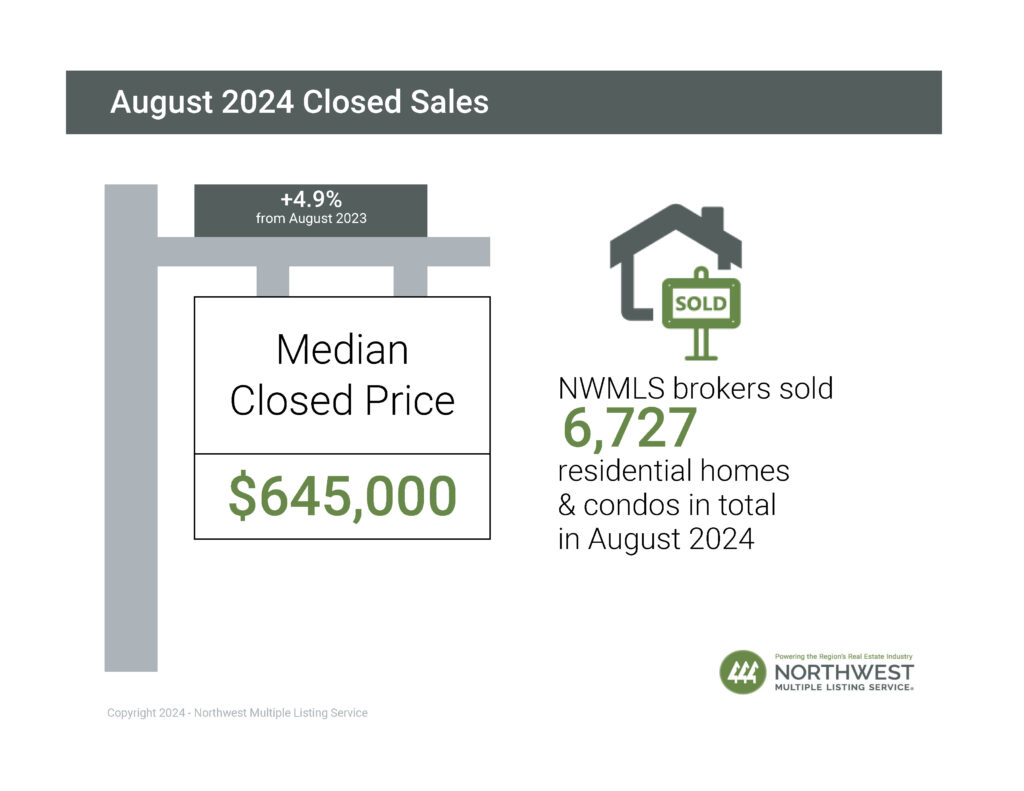
Closed Sales
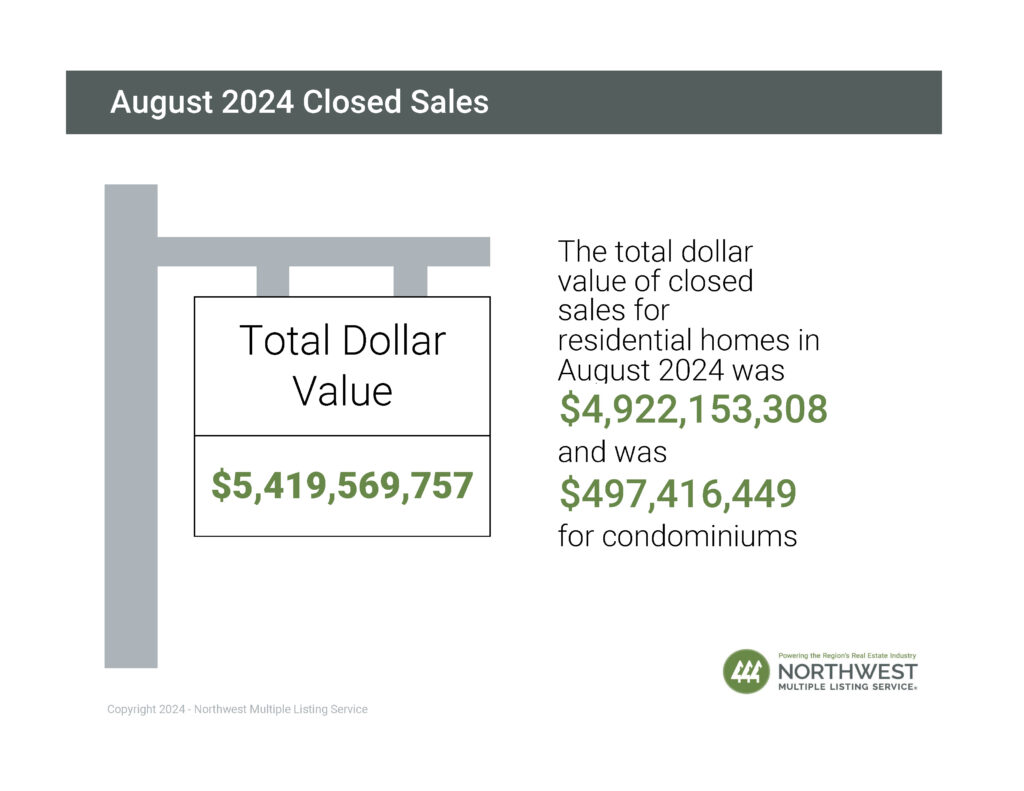
The number of closed sales remained virtually unchanged year-over-year (6,727 in August 2024 compared to 6,734 in August 2023). 15 out of 26 counites saw an increase in the number of closed sales year-over-year, while 11 saw a decrease. The total dollar value of closed sales in August 2024 for residential homes was $4,922,153,308 and was $497,416,449 for condominiums, an increase of 4.7% when compared to August 2023.
Use the drop-down menu in the chart below to view the number of closed sales in each county:
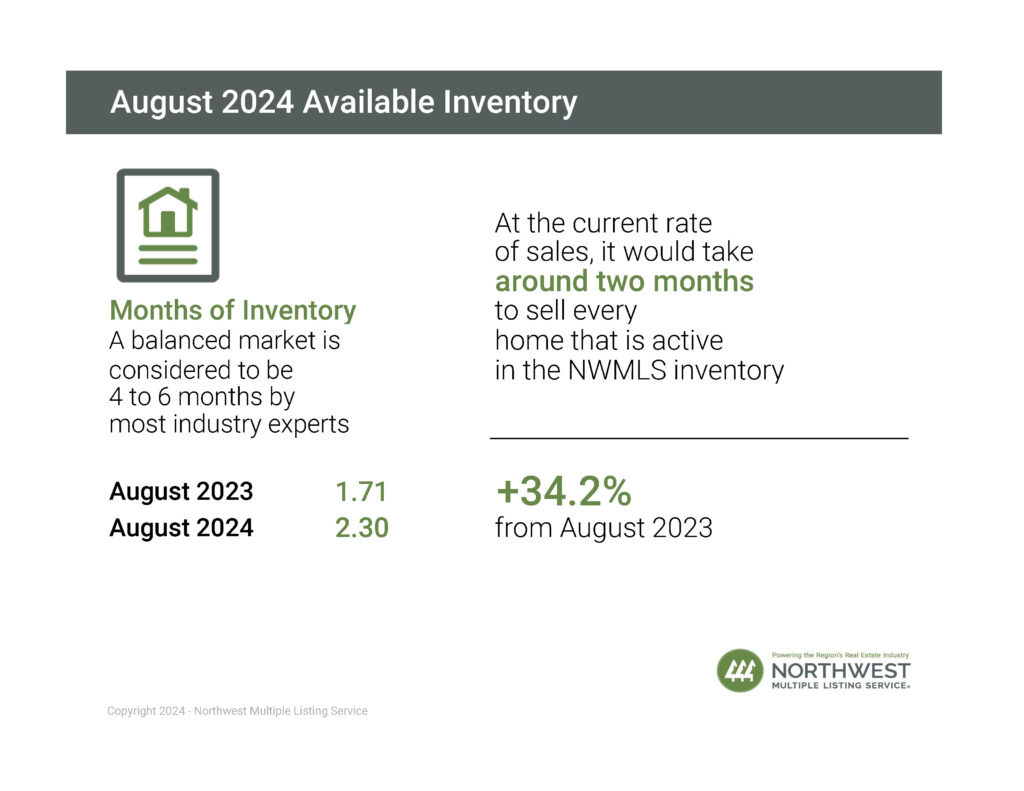
Months of Inventory
A balanced market is considered to be 4 to 6 months by most industry experts. At the current rate of sales, it would take a little over two months (2.30) to sell every home that is active in the NWMLS inventory. The six counties with the lowest months of inventory in August 2024 were Snohomish (1.41), Kitsap (1.61), Thurston (1.7), King (2.08), Pierce (2.08), and Skagit (2.23).
Use the drop-down menu in the chart below to view the months of inventory in each county:
Median Price
Overall, the median price for residential homes and condominiums sold in August 2024 was $645,000, an increase of 4.9% when compared to August 2023 ($615,000). The three counties with the highest median sale prices were San Juan ($905,000), King ($860,000), and Snohomish ($762,500), and the three counties with the lowest median sale prices were Ferry ($282,500), Adams (%307,475), and Pacific ($332,500).
Use the drop-down menu in the chart below to view the median sales price in each county:
Market Snapshot Video
Market Trends & Statistics
View Historical Real Estate Statistics.

Get granular on real estate statistics with interactive charts encompassing the length of active, new, and additional metrics.
View Individual Counties in PDF Format
Usage Terms
You may share and republish NWMLS’s Market Snapshot Video, interactive charts, and infographics on websites, blogs, and social media. Any use of NWMLS’s statistical charts or infographics must include the logo that is displayed on the graphics and the following attribution: “Information and statistics compiled and reported by the Northwest Multiple Listing Service.” You may not alter or otherwise modify NWMLS’s Market Snapshot Video, interactive charts, and infographics. Derivatives of NWMLS’s housing marketing statistics may not be published, broadcast, rewritten or redistributed without prior written permission.