Published on:
As NWMLS celebrates its 40th anniversary in 2024, let’s reflect on how housing market data has transformed over the past four decades.
Accurate housing market data is essential for understanding trends, pricing, and buyer preferences. Over the years, NWMLS has continuously improved its data collection and reporting capabilities, offering members advanced tools and detailed market statistics. These resources empower NWMLS brokers to provide their clients with valuable insights into the ever-changing market.
1980s – Dawn of the Listing Database
The first MLS databases were created in the early 1980s. Brokers would fill out listing input sheets which NWMLS staff (named PSMLA at this time) would collect on a daily basis. The information was then manually input into large terminals in the data room. Data was transmitted to a Seattle-based company named International Graphics, and was compiled and printed on large presses to create books with all the active listings in six geographic areas that were delivered to members.
In addition to listing books, NWMLS distributed quarterly “sold” books to member real estate firms. These books, released every three months, detailed every property sold during that period in each geographic region. They also included basic statistical data for all properties sold within the specified timeframe, such as:
- Number of units sold
- Overall dollar volume for sold listings
- Average sold price
- Average listing price of sold listings
- Percentage of listing price received
- Average time on market
- Number of pending sales
- Number of active listings
- Average listing price of properties not sold
- Number of listings that were pending, active, or sold, by price range and bedrooms

To create CMAs, brokers would use the sales book to identify potential comparable properties. At this time, brokers would review the book to find comparables based on the available data (bedrooms, bathrooms, square footage, etc.), and would then physically visit the neighborhoods to review other factors that might impact the value, such as the view or the condition of the property.
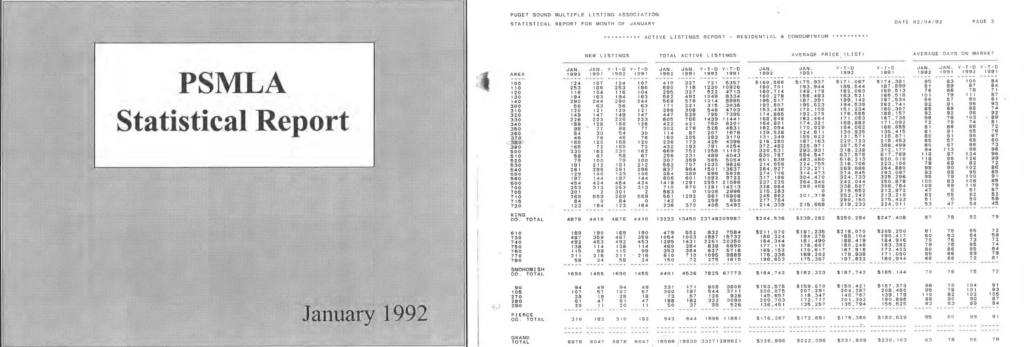
Early 1990s – Production of Statistical Housing Market Reports
Moore Data Business Systems acquired International Graphics, the company responsible for compiling listing data for the printed MLS books, and introduced RealTrieve MLS—a sophisticated software program capable of generating detailed housing market reports.
With this innovation, Moore began producing monthly statistical reports in addition to the quarterly sales books. These 30-page reports provided comprehensive data on the housing market in King, Snohomish, and Pierce counties, the service area of PSMLA at the time. The reports also included specialized sections with data broken down by property type and new construction category: residential only, condominium only, new construction residential, and new construction condominiums.
At the end of each year, a 12-page report was produced that summarized housing market activity across all three counties.
Fun Fact: NWMLS brokers can access these historical reports by visiting the NWMLS Statistics Archive on the member site!
Late 1990s – NWMLS Provides Online Access to Statistical Data
NWMLS developed an automated program to generate monthly statistical reports, bringing the production of these reports in-house. With the launch of a new website, northwestmls.com, members gained online access to these reports, eliminating the need for printed quarterly sales books.
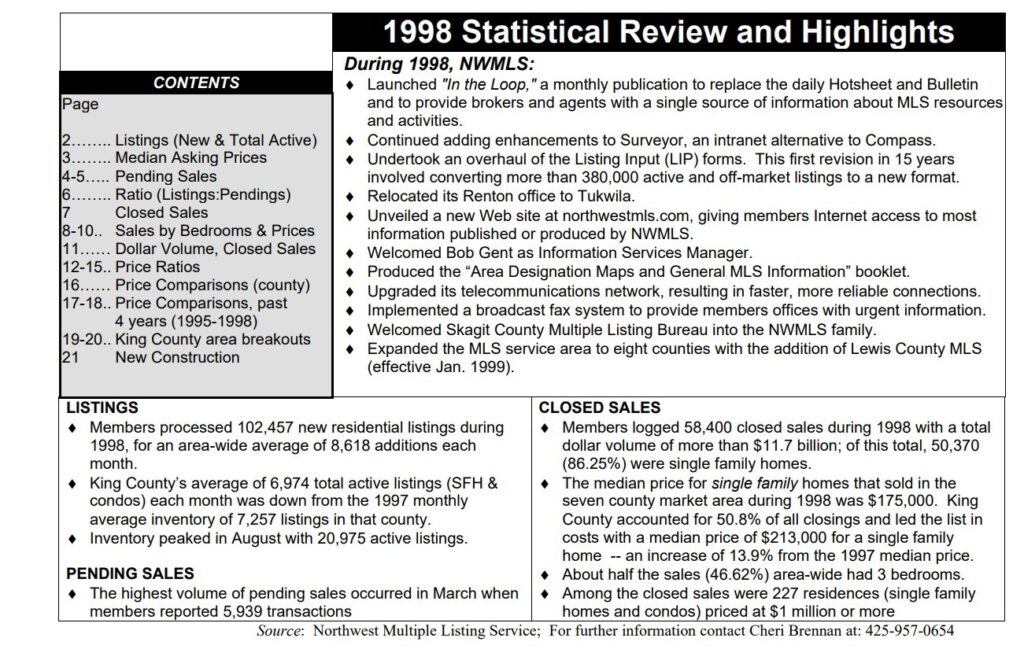
Additionally, NWMLS introduced an Annual Statistical Review Report to summarize key housing market data and highlight the year’s accomplishments.
2000s – Continued Expansion and Enhanced Statistical Reports
By 2000, NWMLS had expanded to provide statistical market data reports for 13 counties within its growing coverage area. Monthly reports were created for each county, along with a comprehensive 31-page summary of all housing activity across the NWMLS region.
As brokers began listing additional property types, NWMLS adapted its reporting to include these categories. County-specific reports were updated with a new section detailing the total Pending and Closed Sales for various property types, including Residential, Condominium, Vacant Land, Multi-Family, Commercial/Industrial, Manufactured Home, Leased Space, and Business Opportunity.
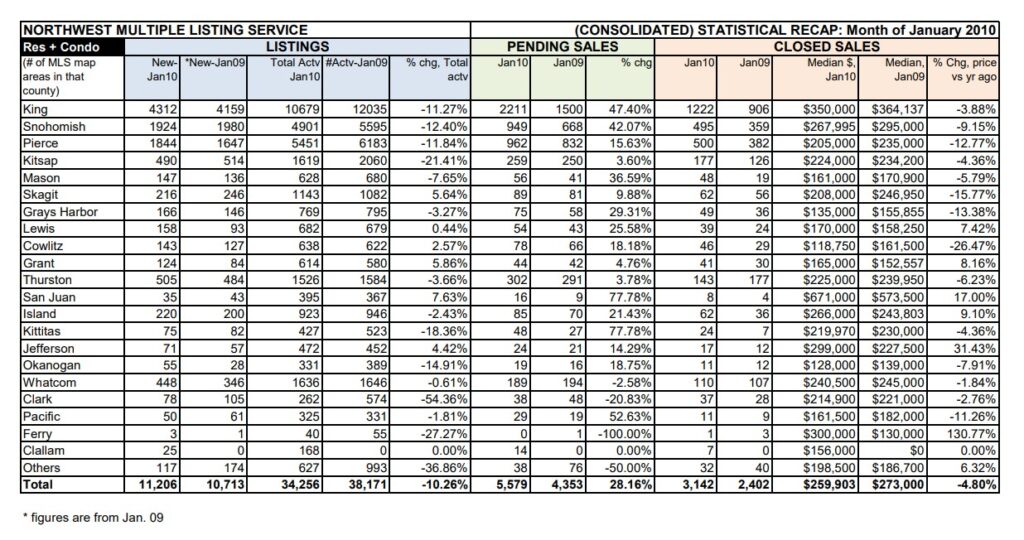
By the end of the decade, NWMLS was reporting housing market data for 21 counties. Each month, a 58-page report was (and continues to be) produced for each county, along with a three-page summary report. The summary combines Residential and Condominium data across all counties and includes key metrics such as New Listings, Total Active Listings, Pending Sales, Closed Sales, and Median Prices.
2010 – Launch of the Matrix Statistics Generator
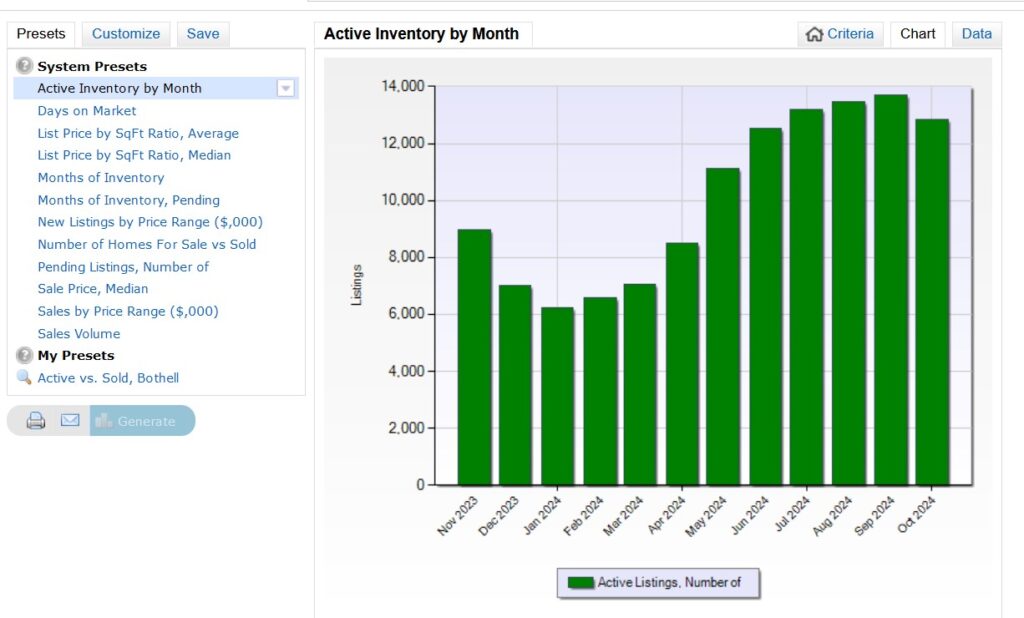
The Matrix Stats Generator, a powerful new tool, was introduced to give NWMLS brokers the ability to create custom statistical reports and graphs. This tool is still available, and allows NWMLS brokers to quickly generate stats using featured system presets, such as Days on Market, List Price vs. Sale Price Ratio, or Months of Inventory. Brokers can apply criteria and timeframes to refine their results, and then create detailed reports for their local market or any housing market within the NWMLS service area. These reports can be easily printed or emailed to clients or colleagues, offering a convenient way to share valuable market insights.
Late 2010s through Early 2020s – InfoSparks with FastStats and Other Tools
With the rise of social media and online blogs, NWMLS launched InfoSparks with FastStats for its membership, an innovative statistical tool. InfoSparks is an easy-to-use, interactive platform that combines local geography with customizable housing variables, transaction types, timeframes, and market metrics, enabling NWMLS brokers to analyze and share trend data through a clean, intuitive interface.
Graphs created with InfoSparks can be shared in various ways, including a “live” option that automatically updates with the latest data, ensuring ongoing relevance. NWMLS brokers can embed graphs into blogs or websites, share them on social media, or download the data as a CSV file for further analysis.
Fun Fact: NWMLS offers an advanced instructor-led course, Statistics Tools, that reviews how to use all of the products mentioned in this article. NWMLS brokers can register online to attend a local, in-person course, or via Zoom depending on preference. NWMLS classes are free, or pay $15 for 3 clock hour credits towards your next license renewal.
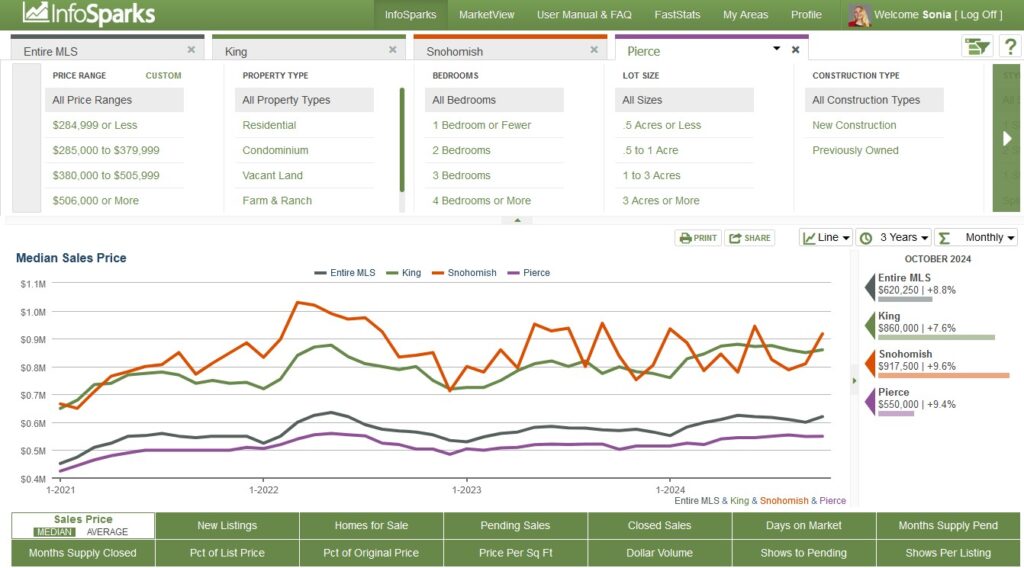
One year after launching InfoSparks with FastStats, NWMLS introduced MarketView, a module for broker, office, and firm rankings and research, seamlessly integrated within InfoSparks. This module makes it easy for NWMLS brokers to analyze and compare market performance in a variety of ways.
Around this same time, NWMLS began producing monthly infographics to help illustrate important housing data. By 2020, the infographics were incorporated into a fun Monthly Market Snapshot video that can be shared each month with clients!
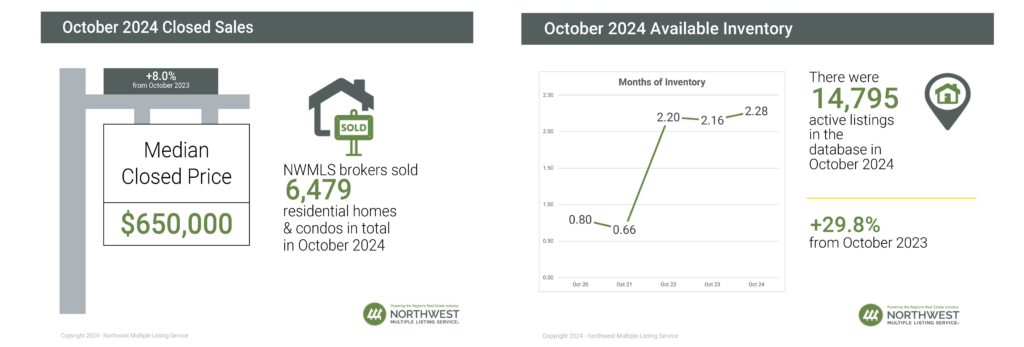
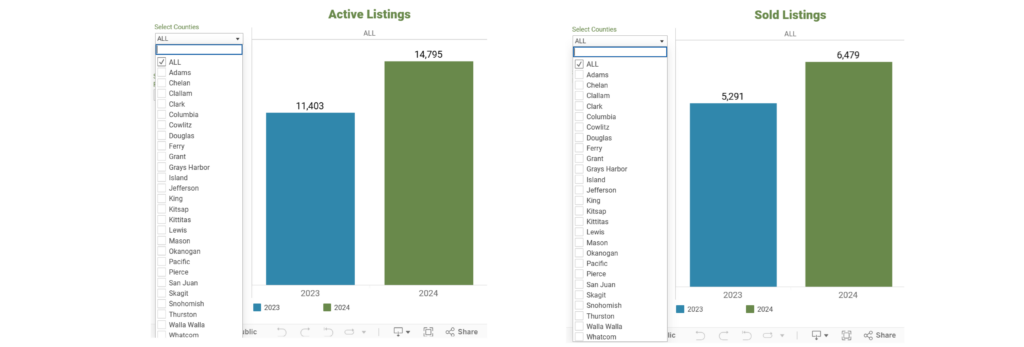
Most recently, interactive charts were introduced to help brokers and their clients visualize important real estate trends that are highlighted in the NWMLS statistical press release and infographics, including number of active listings, new listings, pending sales, closed sales, median price and months of inventory. 5-year charts are also available to help describe overall real estate market trends to clients. Brokers can view data for individual counties or multiple counties by using the drop-down filter menu in the upper left of each chart.
NWMLS brokers can then share or download the interactive chart and embed it on a personal website, send it via email, or publish it to clients on social media.
2024 & Beyond
Today, NWMLS provides monthly housing market data reports for 26 counties and continues to invest in advanced technology and tools that help members analyze their local housing markets.
In addition to real-time graphs and reports, NWMLS brokers have access to over 30 years’ worth of statistical data, offering insights into various housing market metrics across the Pacific Northwest.