Published on:
As NWMLS celebrates our 40th Anniversary in 2024, let’s take a look back at how comparative market analysis (CMA) has evolved over the last four decades.
Did You Know? A comparative market analysis (CMA) estimates a home’s price based on recently sold, similar properties in the immediate area. Brokers create CMA reports to help sellers set listing prices for their homes and help buyers make competitive offers.
1980s – Quarterly Sales Books
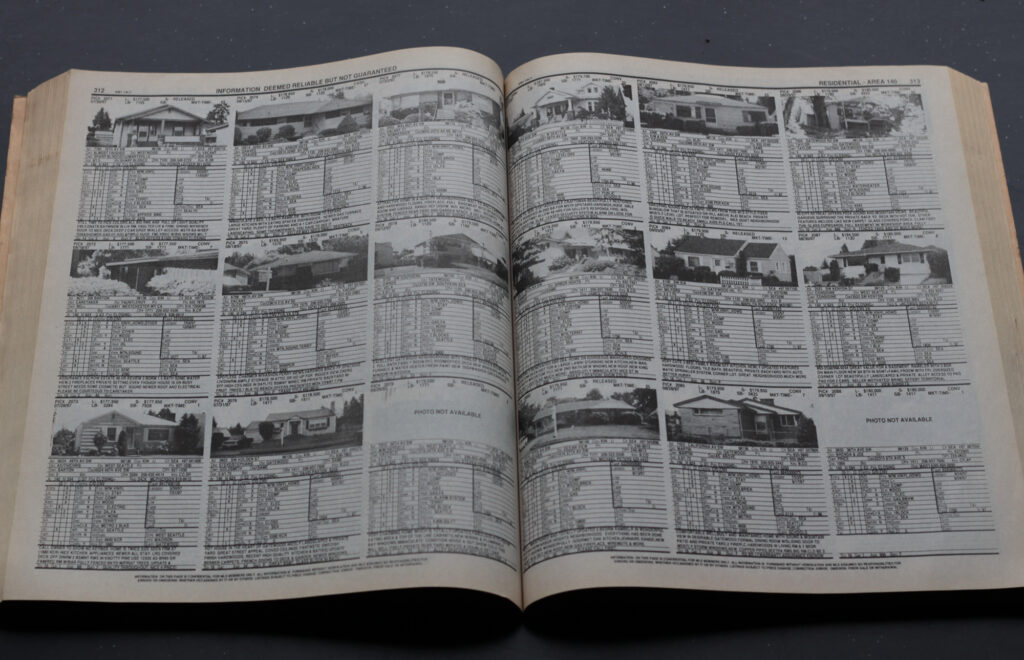
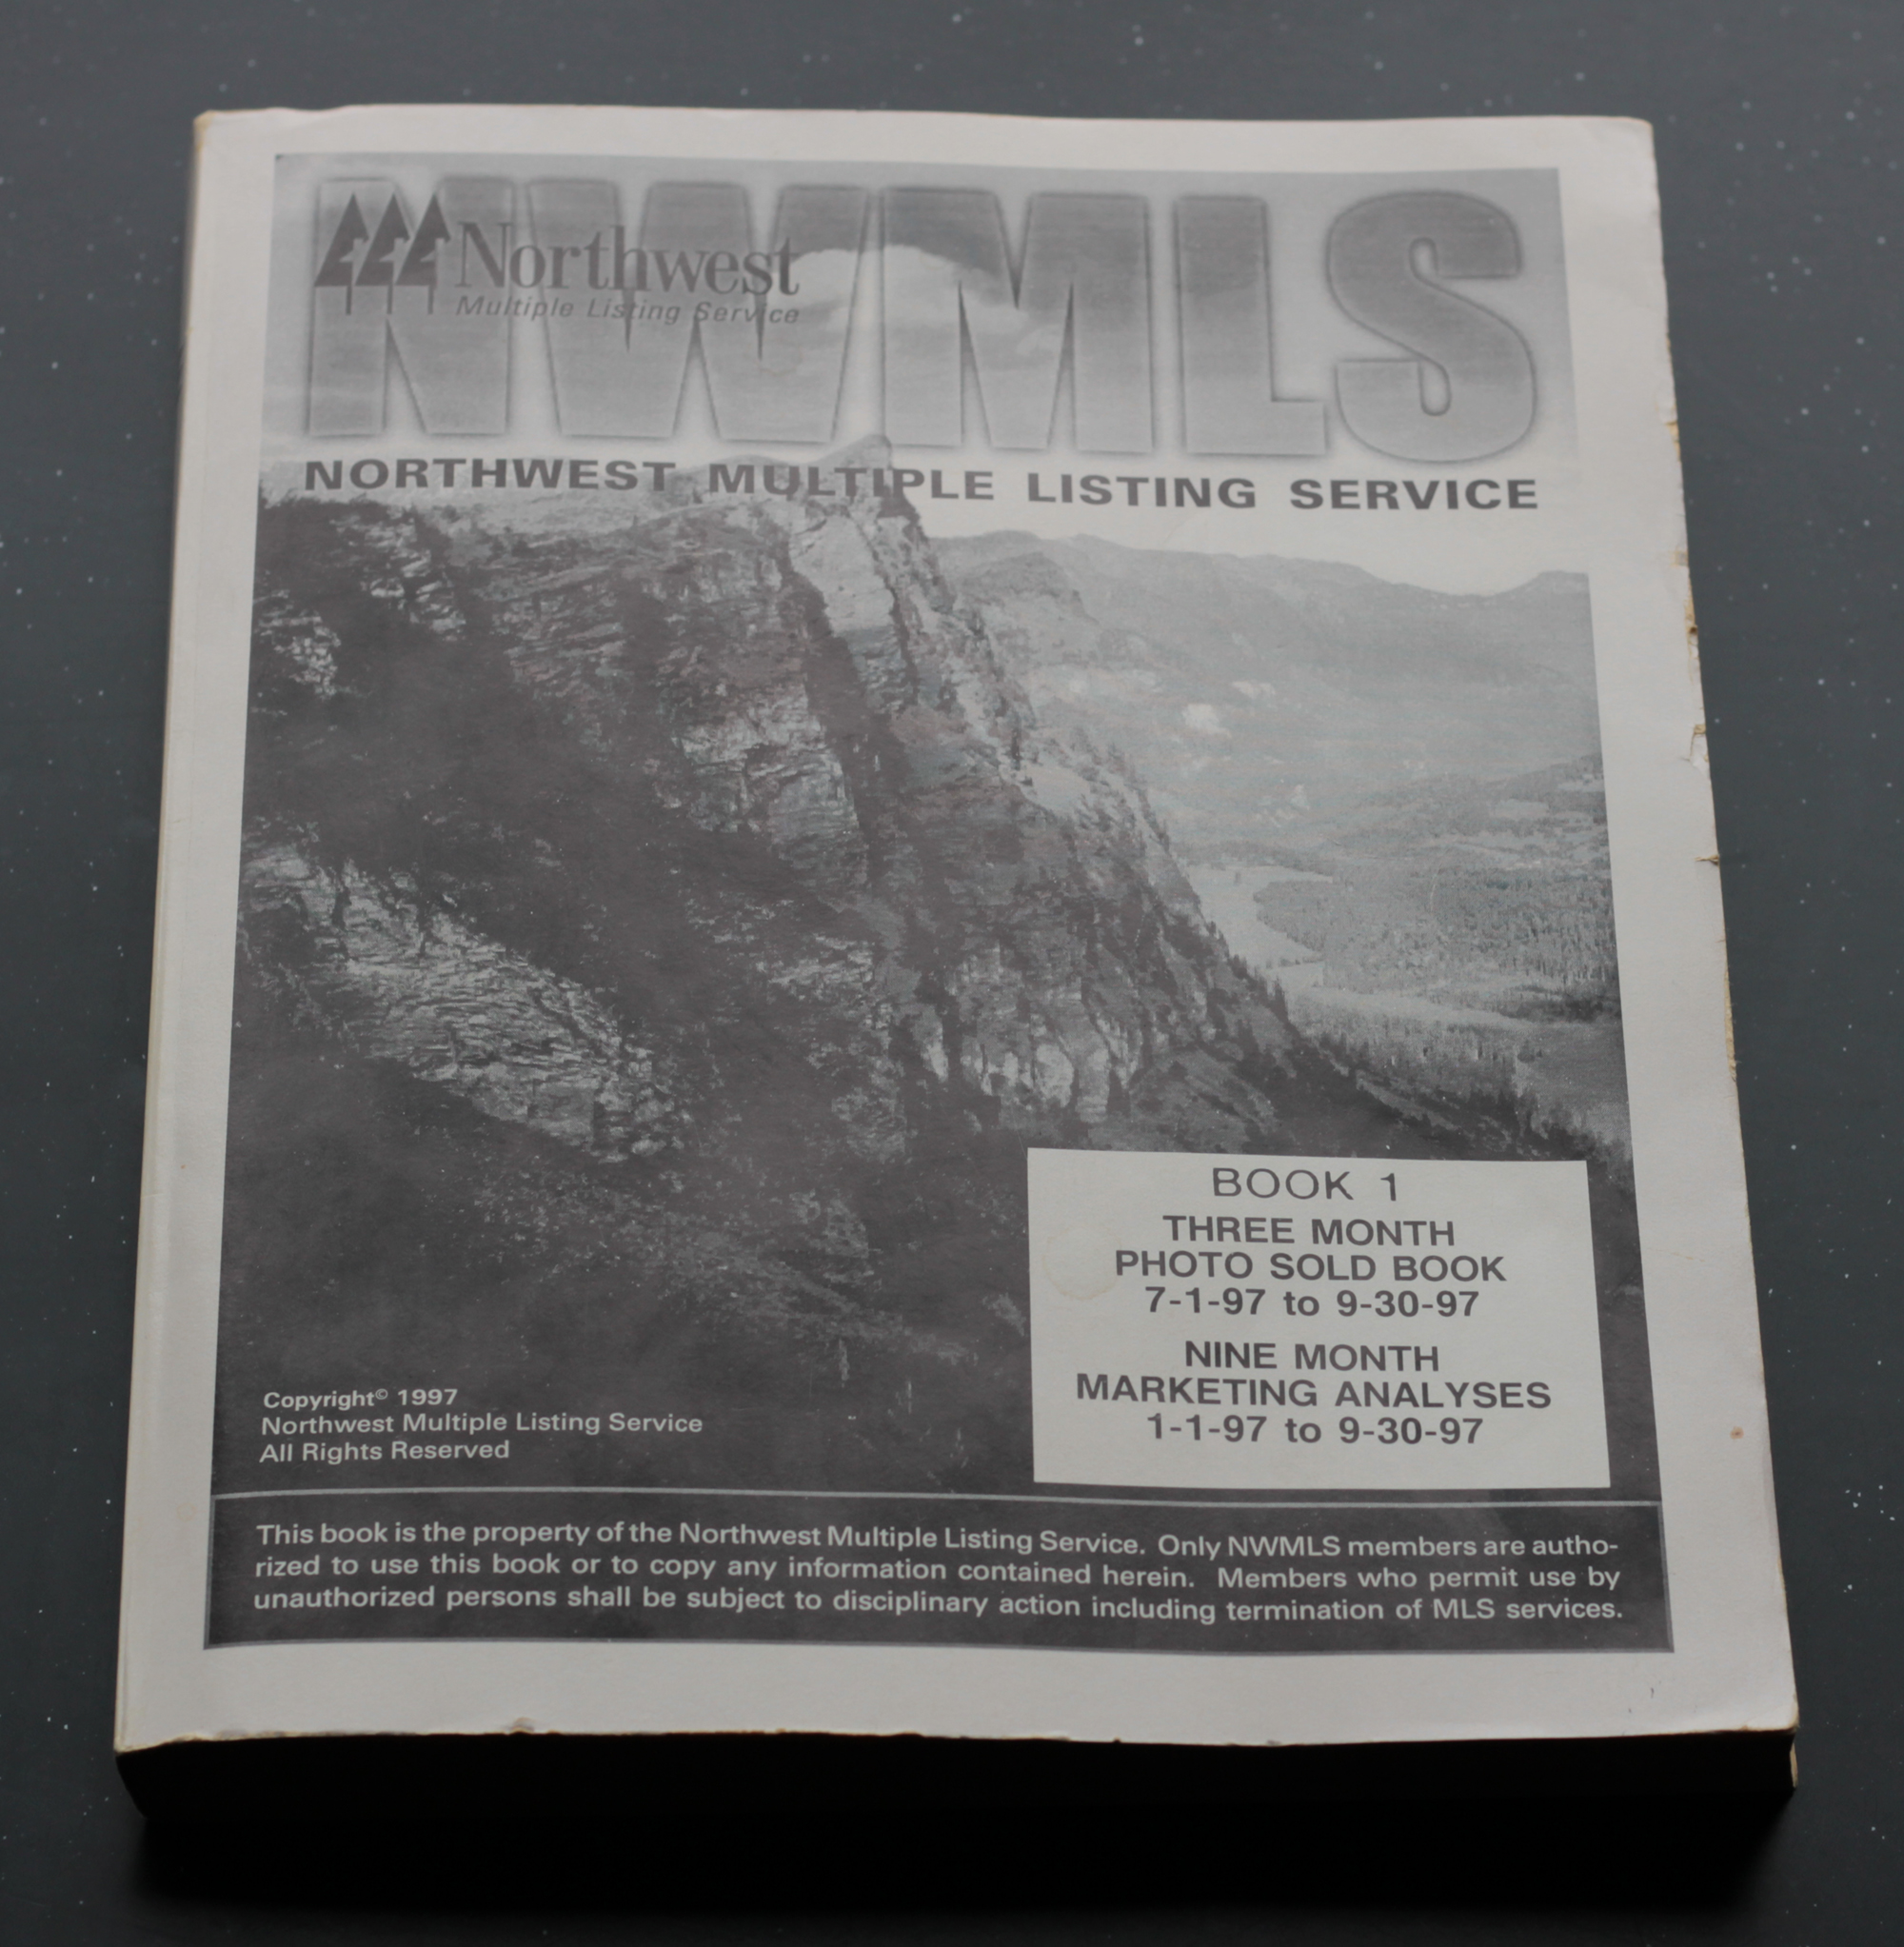
Paper books were printed and distributed by the MLS every three months to member real estate firms, with details about every property that had sold during that time frame. Member offices would subscribe to receive the printed books they desired for their market areas, because separate books were printed for each of the MLS’s six geographic regions at that time. Each listing had the closed sales price, a basic description of the home, and a single black and white photo. Some properties had no photo at all!
To create CMAs, brokers would use the sales book to identify potential comparable properties. At this time, brokers would review the book to find comparables based on the available data (bedrooms, bathrooms, square footage, etc.), and would then physically visit the neighborhoods to review other factors that might impact the value, such as the view or the condition of the property. CMA presentations at this time were typically a rudimentary one-line report with information about three or more comparable sold properties.
1990s – Third-Party CMA Software
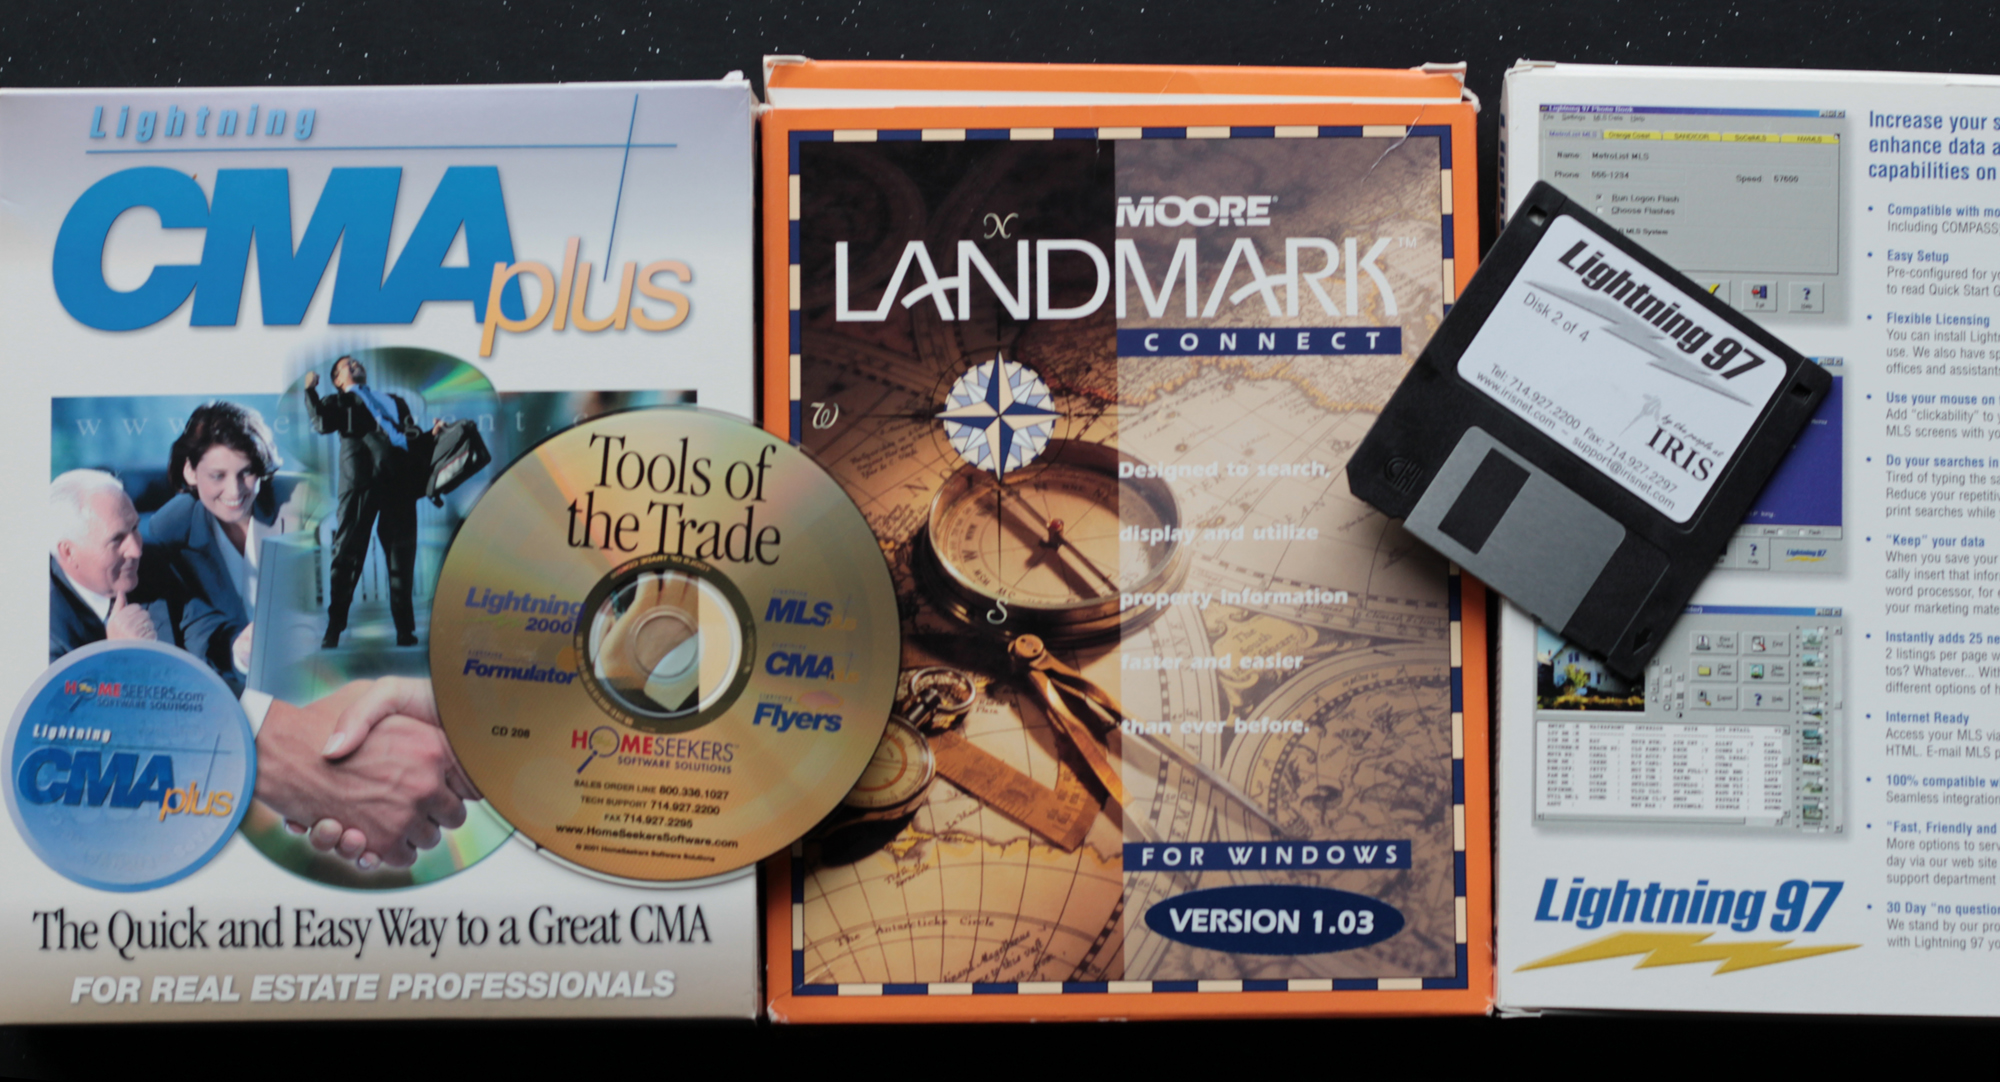
As personal computers became more common, software programs were developed to help brokers search and sort through property listing information in the MLS database. A variety of third-party software packages were introduced, with many offering CMA packages.
These software programs allowed brokers to make selections with a single mouse click instead of having to type details into each individual field. Brokers could generate sophisticated and detailed statistical reports to create professional CMA presentations to support their suggested listing price. Instead of the simple three-line reports of the past, CMA presentations could include subject property information and robust property information about each comparable sale.
However, to find appropriate comparable sales, brokers had to go through a very manual process, often involving several complex searches.
Early 2000s – Locator CMA
As technology continued to advance, NWMLS adopted a new MLS program, Locator. Searching became much easier with drop-down menus and checkboxes, allowing brokers to enter their search criteria without the need for field codes. Locator provided a variety of CMA features, which many brokers began using instead of purchasing third-party software.
Brokers could select a subject property and click “CMA” to generate a report directly within Locator.
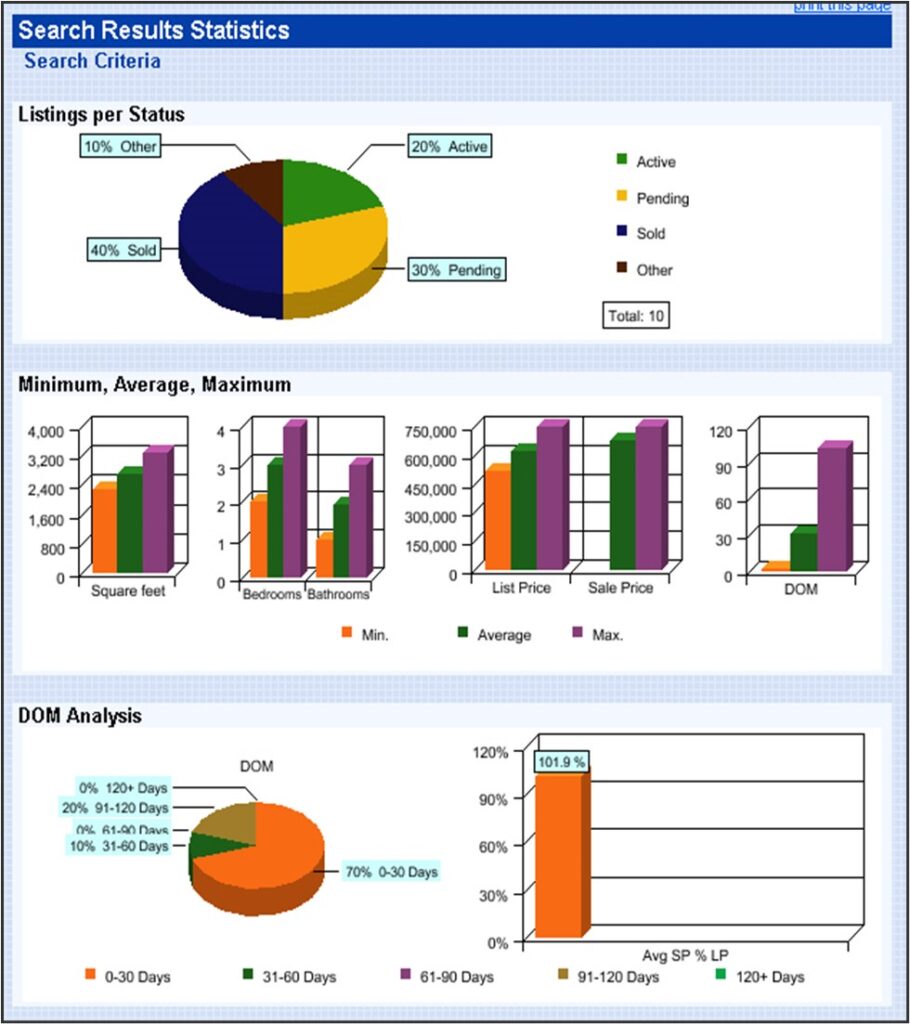
Locator also offered a variety of reports and statistical data that brokers could use to help explain market conditions to their clients.
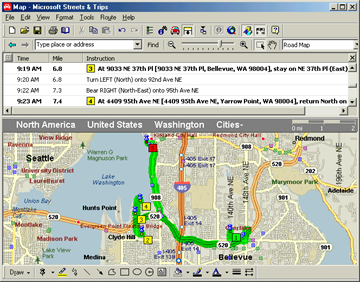
Mapping Software Programs – Microsoft launched the Streets & Trips program and MapPoint 2001 program, which allowed brokers to create maps displaying the location of comparable properties or create detailed street-by-street driving directions.
Mid 2000s – Realist Property Records
Realist, a public tax records database, was integrated with Locator offering more in-depth property data information. Brokers could use Realist to find and include unlisted comparable properties in their CMA reports.
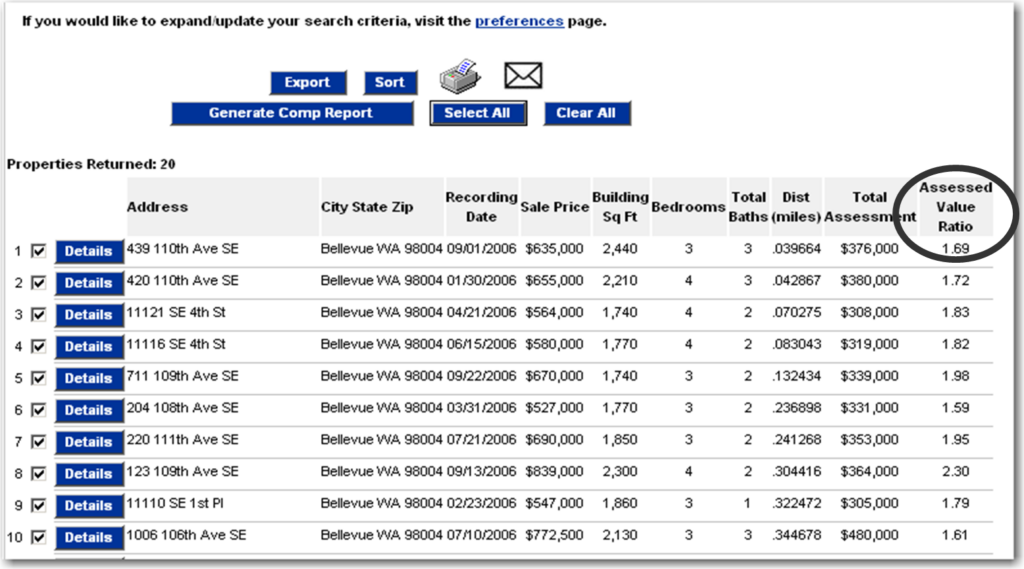
The Realist Comparables function displayed an Assessed Value Ratio for each sold property, which is a calculation comparing the property’s assessed value (from the county tax accessor) and the property’s sales price. For example, if a property’s Total Assessment was $376,000 and its Sale Price was $635,000, its Assessed Value Ratio (auto-rounded to the nearest hundredths place) would be 1.69:
$635,000 / $376,000 = 1.69
Brokers could determine the average Assessed Value Ratio for comparable properties and then multiple that ratio by their subject property’s assessed value to help determine its projected value. This data is still available to NWMLS brokers today in Realist.
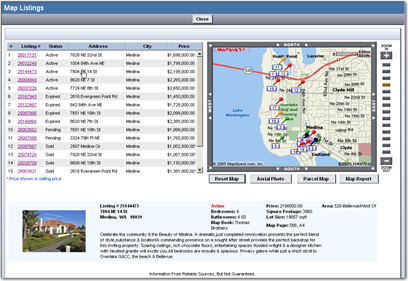
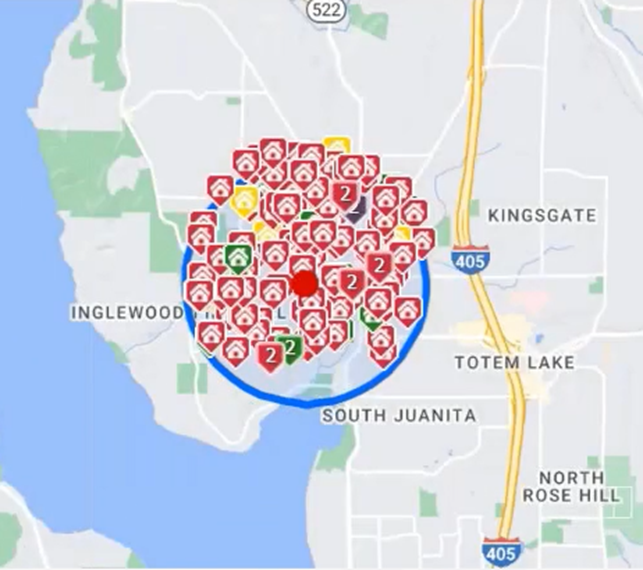
Online, Interactive Maps – Locator introduced online, interactive maps, making it easier than ever for brokers to find comparable properties based on location. Brokers were able to see the exact location of each comparable property in the neighborhood at a glance and “unpin” properties that were inappropriate or draw a box around a specific area and run another report.
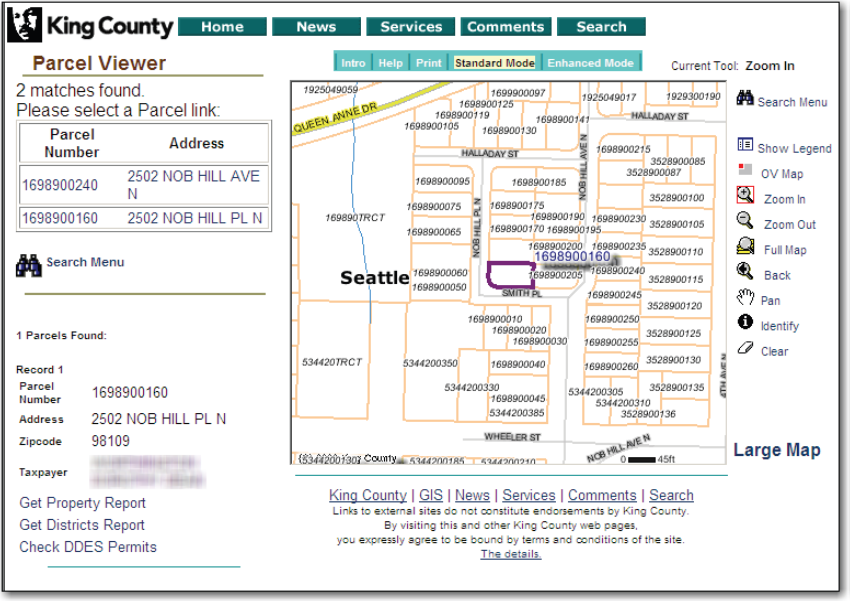
County Assessor Websites – As more information was made available online, county websites were also valuable for research, with substantial information to help with listing and selling properties. Many offered more information than what was provided in the MLS database. County websites gave brokers access to property characteristics, deeds, assessor maps and layers of GIS data to learn more about the subject property and neighborhood.
2010 – Matrix CMA
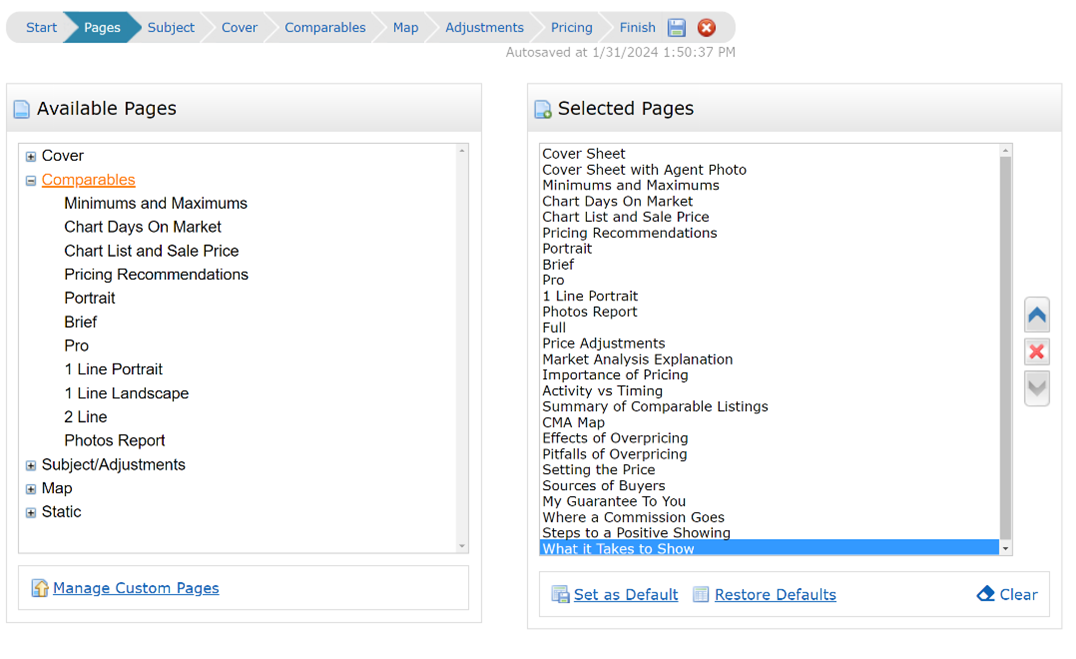
NWMLS adopted the Matrix MLS database, with a step-by-step CMA wizard to help brokers create detailed and professionally formatted presentations that can be printed out, or sent to clients via email.
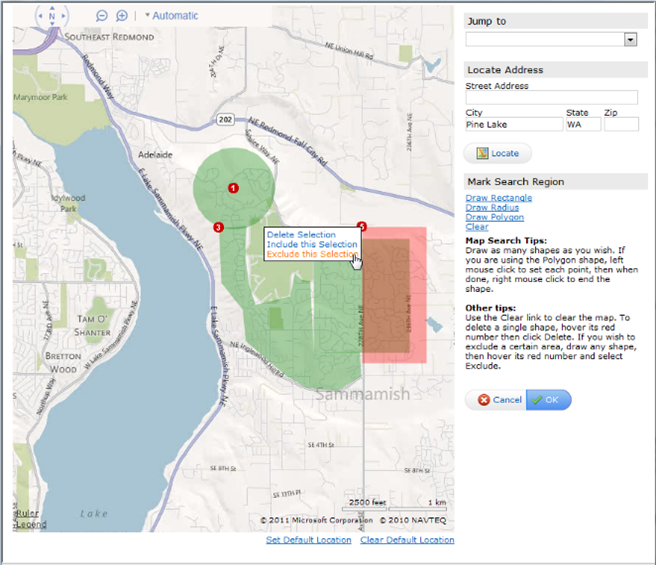
The mapping feature provides brokers with the option to draw a specific radius (.25 to 25 miles) around the subject property, or draw a custom border to zero in on specific locations.
2012 – Matrix Stats Generator
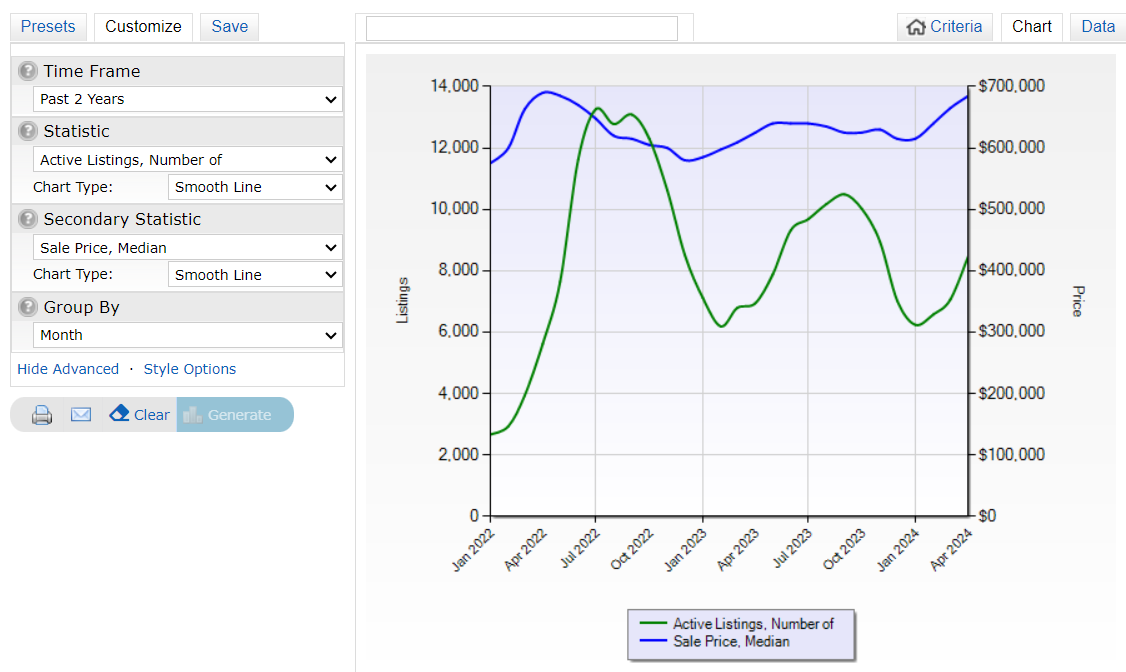
Matrix was enhanced with a Stats Generator feature in 2012, allowing NWMLS brokers to quickly generate statistical data and graphs to view trends in the real estate market. A variety of customizable options allows brokers to choose one or more statistics, a time frame, and a “group by” option to create statistical charts and data to illustrate market conditions for clients.
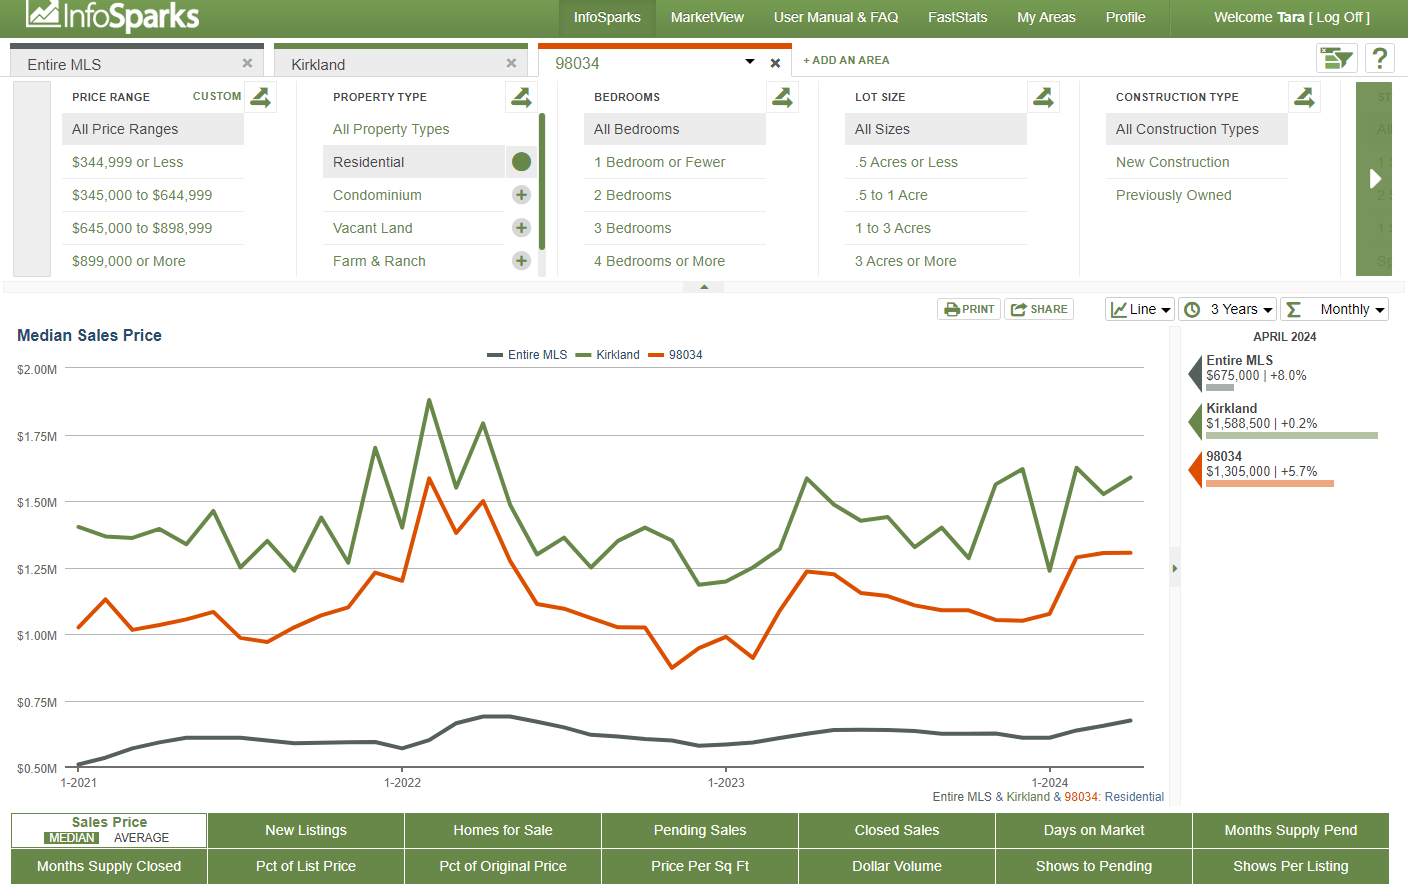
2017 – InfoSparks with FastStats
NWMLS added InfoSparks with FastStats as an additional statistics tool for its membership. NWMLS brokers can create and share customized charts and graphs using InfoSparks, or quickly access local market statistics using FastStats. Once created, brokers can share custom sales data on their website, in blog posts, through email, and on social media.
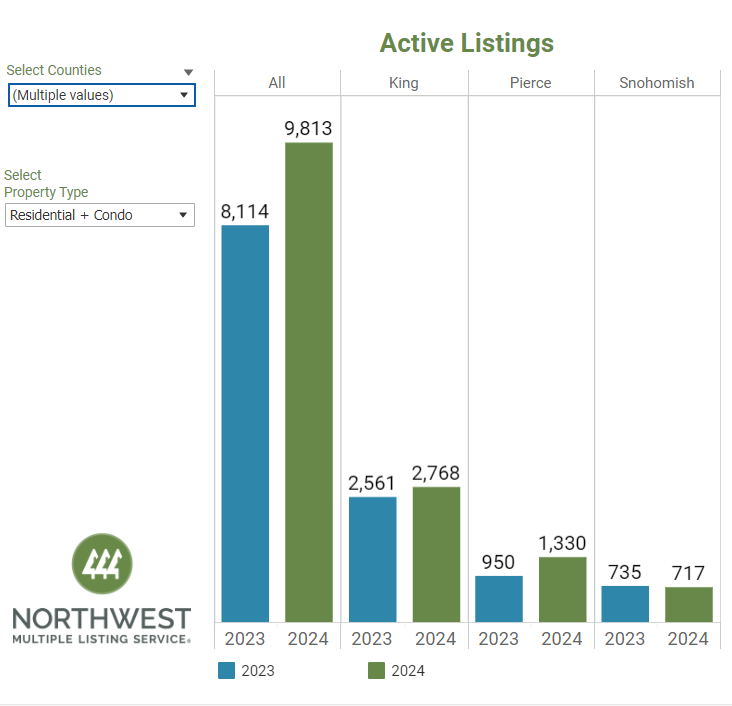
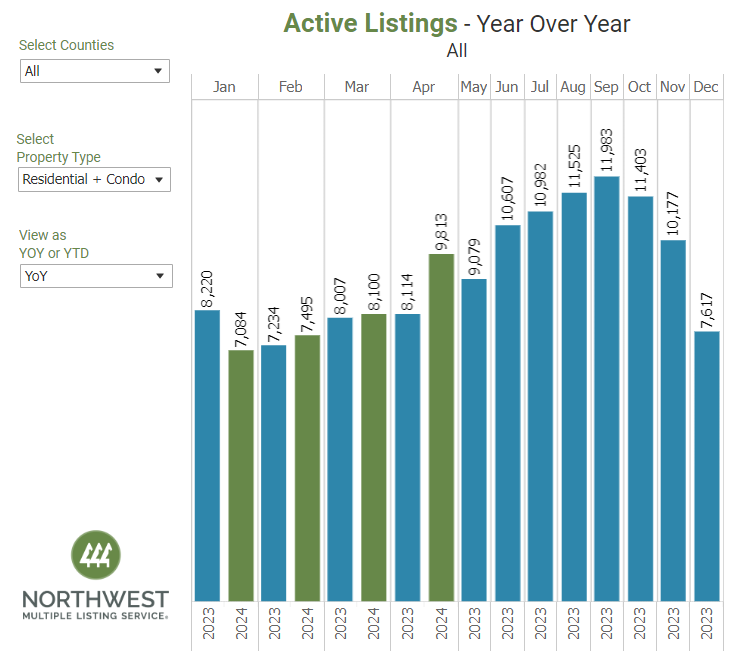
2023 – Interactive Stats Charts
To further enhance the usability of NWMLS’s monthly statistical listing data, new interactive charts were published for NWMLS brokers to access, share, and download. These charts offer a quick visual of important real estate statistics including number of active listings, new listings, pending sales, closed sales, median price and months of inventory. Charts can show data for individual, or multiple counties by using the drop-down filter menu on the left of each chart. The interactive charts can be shared via email or on social media!
Check out the latest statistical charts!
2024 and Beyond
Over the last four decades, NWMLS has brought together the smartest tools in real estate to help our members provide best-in-class service during the home buying and selling process. We are continually reviewing technology products to ensure our membership has access to an array of products, services, and support to help them deliver an exceptional buying and selling experience to their clients.